What is PyCharm?
PyCharm is an extremely popular Python IDE by JetBrains. Among it’s many features is its excellent visual debugger. The debugger lets you step through Python code, line by line, and inspect variables. We can use this to debug our Python code running in Excel.
For professional developers getting a development environment set up that works for you is essential. There’s no one right choice, but PyCharm offers a lot that can help increase productivity when writing Python code.
When writing Python in Excel using PyXLL, you may find at times that you want to use a debugger. Stepping through your code can help you identify what’s going on. A good debugger can be a life saver, and much easier to work with than countless print statements!
PyCharm works well with PyXLL. It’s debugger can attach to the running Excel process, allowing you to step through your Python code in Excel, line by line. It works just in the same way as you can use PyCharm to step through a Python script!
At the time of writing you will require the professional (paid) version for the “Attach to Process” feature. This is required to attach the PyCharm debugger to PyXLL and debug Python in Excel.
Debugging Python in Excel with PyCharm
PyCharm’s debugger has an “Attach To Process” feature. That means you can attach the debugger to a running Python process, even one not started by PyCharm. This is perfect for attaching to the Python interpreter running in Excel through PyXLL!
WARNING:
PyCharm does not yet properly support debugging of Python 3.10.
https://youtrack.jetbrains.com/issue/PY-48037/Support-attach-to-process-on-Windows-with-Python-310
If you are using Python 3.10 until this is resovled by JetBrains you will need to use the old-style “Remote Debugger” documented in the second half of this post.
Python Debugger Configuration
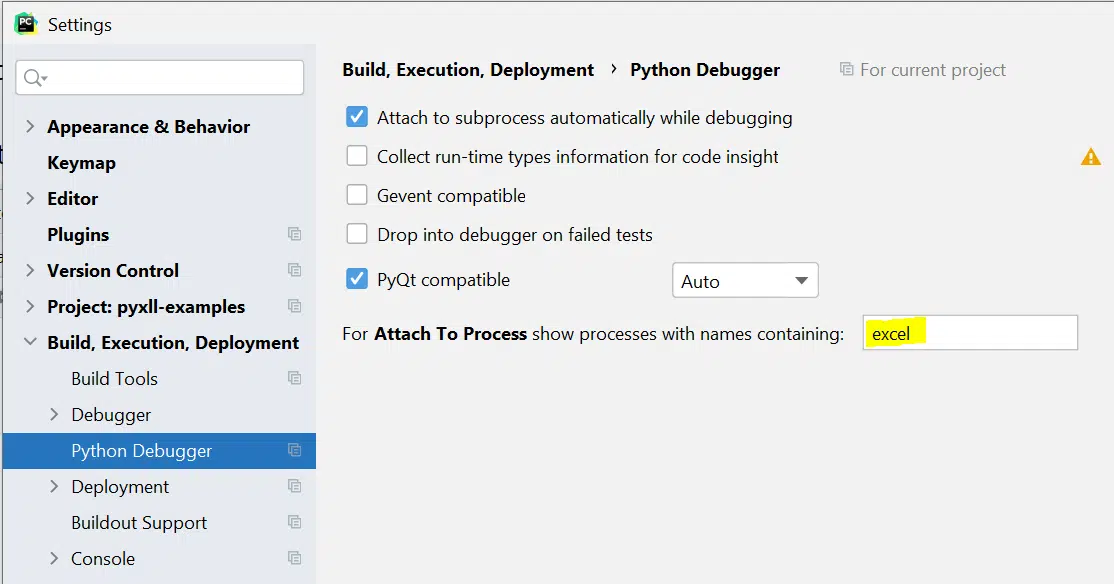
By default, you will only see processes called “python” when attaching to a process in PyCharm. Before you can attach to Excel to debug your PyXLL functions you need to change. Go to File -> Settings, and under the “Build, Execution, Deployment” section find the “Python Debugger” settings. Here you will see the setting “For Attach To Process show processes with names containing:”. This setting is configured as “python” by default. Change this to “excel” to show only Excel processes, or leave it blank to show all processes.
Attaching to Python in Excel
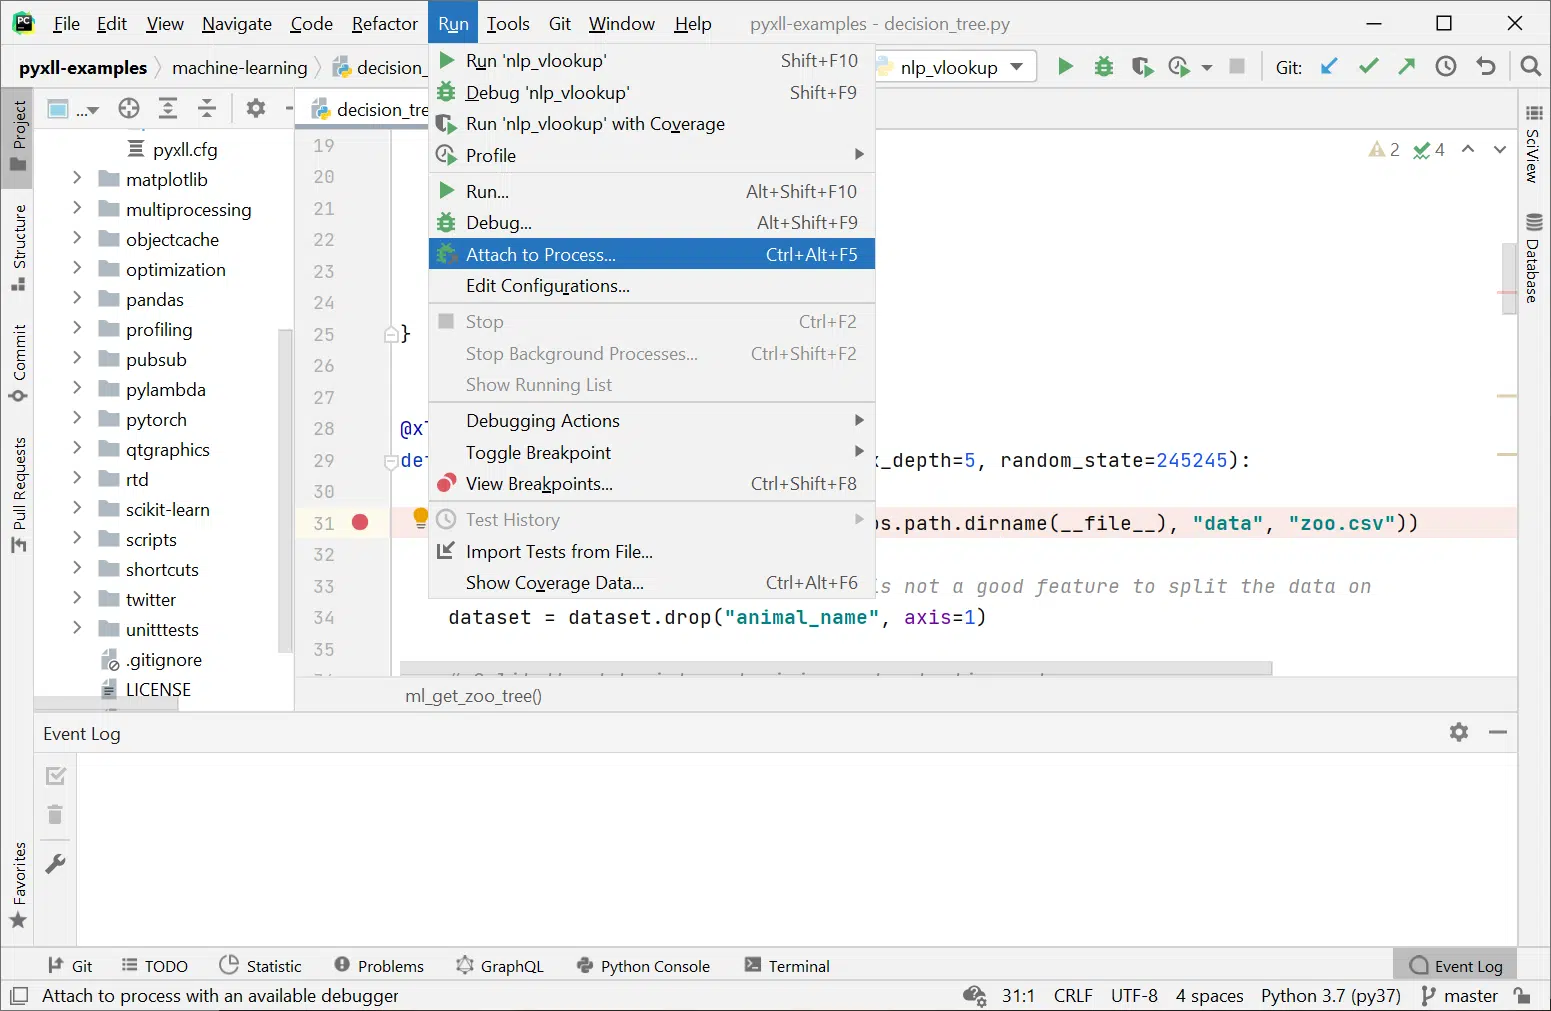
With Excel runinng and the PyXLL add-in loaded, in PyCharm go to “Run -> Attach to Process…”.
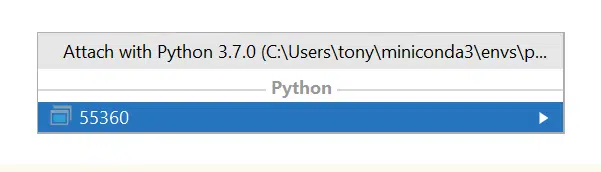
Next PyCharm will present you with a list of processes to choose from. If you followed the steps above to filter the processes containing “excel” you will only see a single process. That is the Excel process you want to debug.
Choosing the right process
If there are multiple Excel processes running check which process you want to attach to using the Windows Task Manager. If you are not sure which process to choose then a quick PyXLL function can tell you the process id. For example:
from pyxll import xl_func
import os

@xl_func
def getpid():
    # This will return the Excel process ID so you know which
    # process to attach the debugger to
    return os.getpid()
Breakpoints and stepping through the code
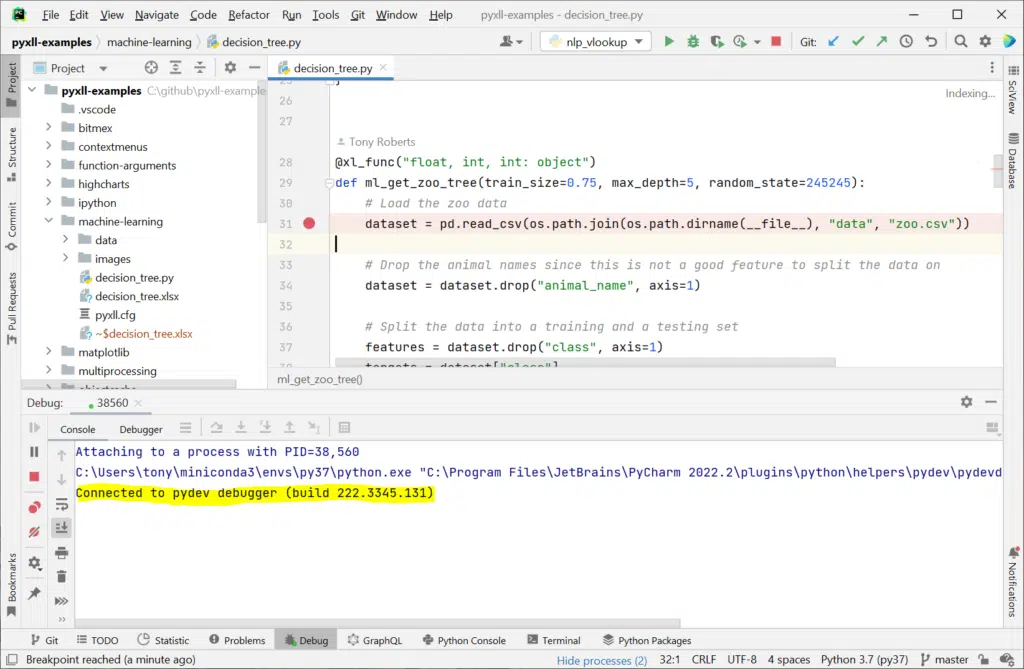
After you’ve selected the Excel process, PyCharm will start connecting. Once connected you will see the following in the debug console in PyCharm:

With the debugger connected you can now set breakpoints. When you run your functions in Excel it will stop on those breakpoints, allowing you to step through your code in the usual way.
Common Problems Attaching to Excel
If you have any trouble in attaching the debugger (or if PyCharm shows a timeout error when attempting to connect) check the following:
- You do not have any of the packages “pydevd_pycharm”, “pydevd”, “debugpy”, or “ptvsd” installed. These will interfer with the operation of PyCharm’s Attach To Process feature unless they are exactly the right version; it is better to not have them installed at all and to let PyCharm use it’s own version of pydevd.
To uninstall these packages run:pip uninstall pydevd_pycharm pydevd debugpy ptvsd
Check they have been removed by looking in your “site-packages” folder.
- You are using the latest version of PyCharm. PyCharm 2022.2 (Professional Edition) was used while writing this post.
- Look in your PyXLL log file for any errors.
For more information about attaching to a process see the PyCharm docs:
https://www.jetbrains.com/help/pycharm/attaching-to-local-process.html
Another (older) way to attach PyCharm to Excel
Prior to PyCharm’s “Attach to Process” feature there was another way to attach PyCharm to Excel. PyCharm is also capable to attaching to a remote processs, even one running on another computer. You can use this to attach to Excel running locally as well, though it takes a little more work than the method described above.
This method is no longer the recommend method. It is left here for anyone unable to upgrade to a newer version of PyCharm.
The method of debugging Excel using PyCharm’s “Remote Debug” feature is explained in this video:
Creating a new Debug Configuration
To begin with you first need to set up a new Debug Configuration in PyCharm so that you can connect to PyCharm and debug your code. Go to “Add Configuration” or “Edit Configurations” on the drop down list of configurations next to the Run and Debug buttons at the top right of your PyCharm window. Click the Plus button to add a new configuration and select ‘Python Debug Server’ (or ‘Python Remove Debug’ in older versions of PyCharm) from the list of templates.
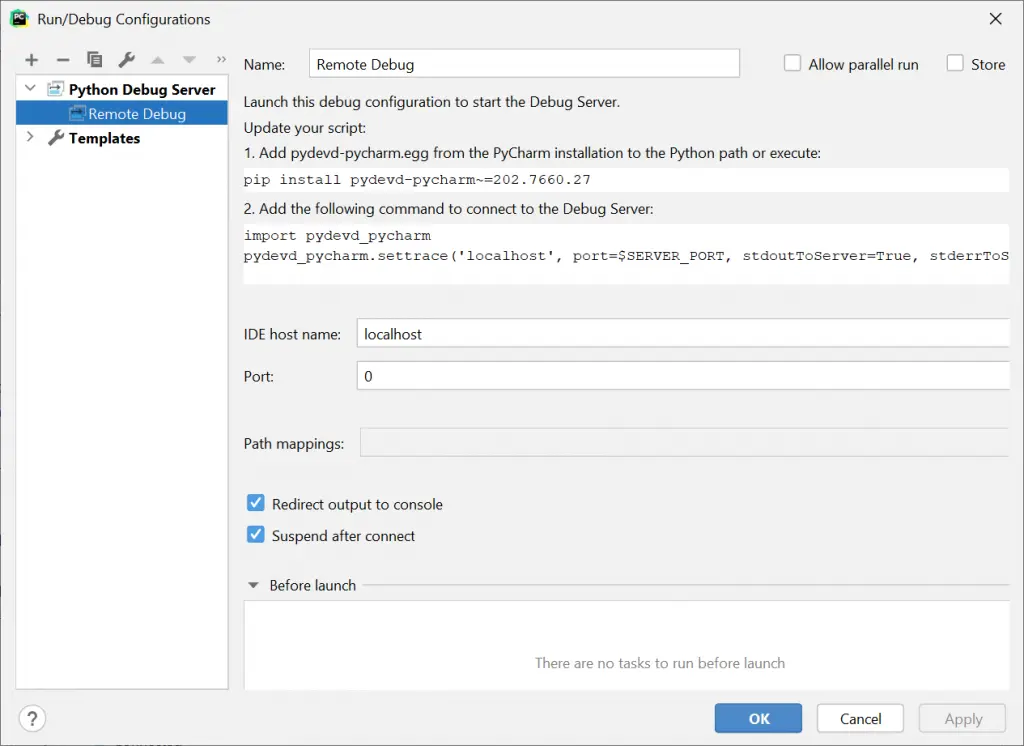
Give your new configuration a name and set the port to 5000. This port is used to connect the PyCharm debugger to the Python code running in Excel. Don’t close this window just yet. Take a note of the string in point 1. on this screen (“pip install pydevd-pycharm~=<version>”) as we will need that in a second.
Installing the pydevd-pycharm package
Next start a Python prompt using the same Python environment that you are using for PyXLL. If you are using a virtual env or a conda env you should activate that. Install the “pydevd-pycharm” package with pip using the command shown in the previous step. You must use the exact same string to ensure the correct version of the package is installed.
If you are using an old version of PyCharm or you cannot use pip for any reason, you can find the pydevd-pycharm.egg file (or pycharm-debug.egg, depending on your version of PyCharm) in the “debug-eggs” folder in your PyCharm installation. To use these egg files add them to the pythonpath setting in your pyxll.cfg file, for example:
[PYTHON]
pythonpath =
    C:\Program Files\JetBrains\PyCharm 2018.2.4\debug-eggs\pycharm-debug.egg
...
Depending on the version of PyCharm you are using you may find there are two eggs, one for Python 2.x and one for Python 3.x. If there are two, make sure you use the correct one. Recent versions of PyCharm just have a single egg to be used for all versions of Python. If you have any other versions of pydevd or pycharm-debug installed you may have to uninstall them so they don’t conflict (check your lib\site-packages folder in your Python environment).
Once you have install pydevd-pycharm using pip, or you have added the egg to your pythonpath, and you have the Python Debug Server configuration added to PyCharm you are ready to connect Excel to PyCharm.
Setting up Excel to connect to PyCharm
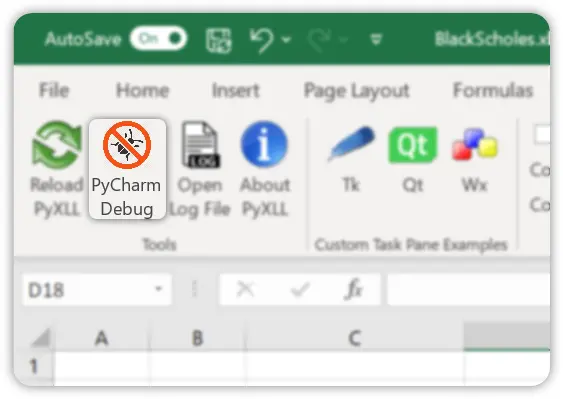
As of PyXLL 5, the easiest way to debug PyXLL add-ins using PyCharm is to install the “pyxll-pycharm” package by running “pip install pyxll-pycharm”. After this package is installed, restart Excel. You will now have a “PyCharm Debug” button in the PyXLL ribbon tab. Before you press the “PyCharm Debug” button in Excel, start the Python Debug Server in PyCharm by selecting the new Debug Configuration you created earlier and press the green Debug button. See https://pypi.org/project/pyxll-pycharm for further details.
If you are using a version of PyXLL prior to version 5 you will need to add some code to your PyXLL add-in to connect Excel to PyCharm. To connect to the Python Debug Server you must call “pydevd.settrace” with the host and port to connect to. You can use a PyXLL menu function to do this, as follows:
from pyxll import xl_menu
import pydevd
import sys

@xl_menu("Connect to PyCharm")
def connect_to_pycharm():
    pydevd.settrace('localhost',
                    port=5000,
                    suspend=True,
                    stdoutToServer=True,
                    stderrToServer=True)

    # reset excepthook to the default to avoid a PyCharm bug
    sys.excepthook = sys.__excepthook__
If you used a port number other than 5000 when creating your run configuration you should change the port in the above code too.
Note that when the code above is executed, it will pause the execution of your program until you continue in PyCharm. If instead you want to allow the code to continue once the connection is made pass the option ‘suspend=False’ to settrace.
There is a bug in recent versions of PyCharm where an uncaught Exception will cause the debugger to detach and Excel to terminate. The line that sets “sys.excepthook” in the above code is a workaround for that problem.
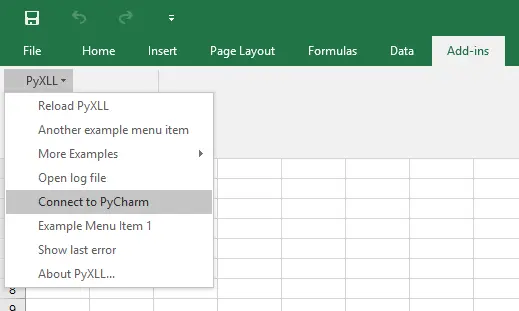
After adding this code to your PyXLL modules, when you reload PyXLL you will now see a new menu item in the PyXLL menu in the Add-ins tab:
Connecting the Remote Debugger to Python in Excel
Before you select “Connect to PyCharm” in Excel, run the “Python Debug Server” in PyCharm. Do that by selecting the Debug Configuration you made earlier and pressing the green Debug button in PyCharm. Once that’s running you can select this “Connect to PyCharm” menu item and it will attempt to connect to the PyCharm debugger.
Once PyCharm is connected you can set break points in the IDE and it will stop when reaching those lines. You can then inspect variables and step though the code line by line.

Warning: If you get an error in PyCharm about path mappings not existing in your project with the path containing odd escaped characters, check the encoding of your pyxll.cfg file is ANSI or UTF-8.
Use the ‘Resume Program’ button in the debug window in PyCharm to continue after hitting a breakpoint. If you press the ‘stop’ button it will disconnect your Python code from the debugger.
For more information about remote debugging with PyCharm, see https://www.jetbrains.com/help/pycharm/remote-debugging.html.
TIP: Rather than write these menu functions yourself you can pip install “pyxll-pycharm” and have a “PyCharm Debug” button added to PyXLL ribbon toolbar automatically. See https://pypi.org/project/pyxll-pycharm. This requires you to be using PyXLL 5 or later.