Animated plots are a great way to liven up a spreadsheet or show a complex data set in a more intuitive way. We can use matplotlib to create animations and display them directly in Excel using PyXLL’s plotting capabilities.
Preparing some example data
To begin with we need some data to plot. I’ve chosen a dataset from the plotly examples we we will load directly from the web, but you could plot data directly from a worksheet or loaded from another source such as a database.
from pyxll import xl_func
import pandas as pd


@xl_func
def load_data():
    url = "https://raw.githubusercontent.com/plotly/datasets/master/volcano.csv"
    df = pd.read_csv(url)

    # Transform it to a long format
    df = df.unstack().reset_index()
    df.columns = ["X", "Y", "Z"]

    # And transform the old column name in something numeric
    df['X'] = pd.Categorical(df['X'])
    df['X'] = df['X'].cat.codes

    return df
This function above loads the data from github into a pandas DataFrame and shuffles it into the format ready for plotting with the columns ‘X’, ‘Y’ and ‘Z’. The @xl_func decorator exposes this function to Excel so we can call it directly from our worksheet as =load_data().
Creating a 3d plot of our data
Next we’re ready to plot our data. Let’s start by writing another function which will plot the DataFrame returned by the first function. It would work just as well with any DataFrame from another data source with the columns X, Y and Z. We could easily pass it a range directly from the worksheet if we had some suitable data.
from pyxll import xl_func, plot
import matplotlib.pyplot as plt
@xl_func("dataframe: str")
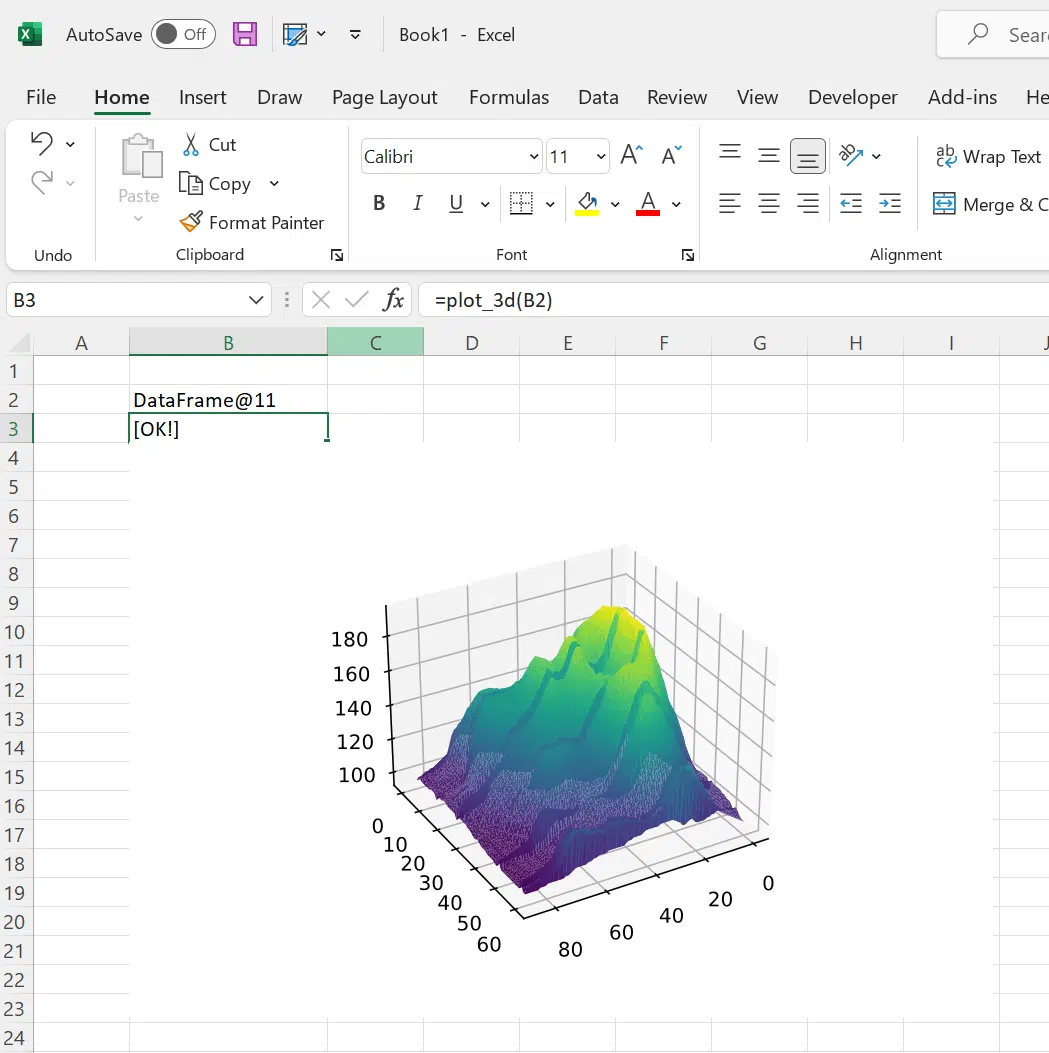
def plot_3d(df):
# Create the matplotlib figure
fig = plt.figure(facecolor='white')
ax = fig.gca(projection='3d')
# Plot our X, Y, Z data
ax.plot_trisurf(df['Y'], df['X'], df['Z'], cmap=plt.cm.viridis, linewidth=0.2)
ax.view_init(30, 60)
# Show the plot in Excel
plot(fig)
# Return a string to Excel
return "[OK!]"
When we call this function with our loaded DataFrame the plot shows in Excel using the pyxll.plot function. Next we’ll make it animate!
Animating the 3d plot
To make this plot animated we’ll use matplotlib.animation.FuncAnimation. The FuncAnimation class takes a function as an argument that will be called several times to update the plot and build up the frames of our animation. In each frame we want to rotate the graph, which is done by calling ax.view_init(30, angle) with the angle we want to set. We’ll do this for angles between 0 and 360 degrees to get a complete rotation.
The dataset I’ve chosen is quite large and rendering the whole animation takes a little bit of time. Depending on the size of your data set you may want to use more or fewer frames to get the right balance between a smooth animation and not having to wait too long for it to render.
from pyxll import xl_func, plot
from matplotlib.animation import FuncAnimation
import matplotlib.pyplot as plt

@xl_func("dataframe: str")
def plot_3d(df):
    fig = plt.figure(facecolor='white')
    ax = fig.gca(projection='3d')

    def init():
        ax.plot_trisurf(df['Y'], df['X'], df['Z'], cmap=plt.cm.viridis, linewidth=0.2)

    # The animate function is called for each frame of the animation
    def animate(angle):
        ax.view_init(30, angle)

    anim = FuncAnimation(fig,
                         animate,
                         init_func=init,
                         frames=range(0, 360, 10),
                         interval=200)

    # Show the animation in Excel
    plot(anim)

    # Return a string to Excel
    return "[OK!]"
With some small changes to our original plot_3d function we’re now producing an animated plot of our data set. The animate function is called for each angle in the range passed to FuncAnimation, rotating our 3d plot 360 degrees to create the animation. Calling the pyxll.plot function renders the animation into a shape object in Excel.

For more information about how to plot using matplotlib and PyXLL please see the following resources: