
As well as using Excel’s own charting capabilities, PyXLL allows you to use Python’s other plotting libraries within Excel.
PyXLL has support for the following Python plotting libraries, and can be extended to support other via custom code.
Using Python’s plotting packages is preferable to using Excel’s own charts in some situations.
You can plot directly from Python and so this can reduce the need to return a lot of data to Excel and make your sheets smaller and simpler.
Using the Python plotting libraries gives you more control over how your charts appear and gives you access to chart types that are not available using Excel’s own chart types.
3d interactive plotly chart in Excel
To show a plot or chart in Excel you use whichever Python plotting library you prefer to generate
the chart and then use PyXLL’s plot function to render it to Excel. See the individual
guides linked above for specific instructions for each.
You can plot directly from an Excel worksheet function decorated with @xl_func, and so you
can provide your own inputs to your plotting function. These can be used to let the user of your
function have some control over how the chart is plotted to make it interactive. Each time they
change an input the plot will be re-drawn.
Depending of which plotting library you use the plot itself will be either be inserted into Excel as an interactive web control [1], or as a static image.
Depending on the version of Excel you are using and the plotting library, the chart may be exported as an HTML document [1] or an SVG image when plotting to Excel.
If you are experiencing problems with HTML charts, or the web viewer control, you can disable
exporting as HTML by passing allow_html=False to plot. This will cause
it to export the image in a static image format instead.
Some plotting libraries can occasionally show problems when plotting to SVG. If you see
any visual errors (for example, borders being too thick or the background color showing
through) you can set allow_svg=False when calling plot. This will cause
it to export the image in a bitmap format instead.
When you use plot from an Excel worksheet function using @xl_func the image
inserted into the Excel workbook will be placed just below the cell the function is being called from.
Additionally, subsequent calls to the same function will replace the image rather than creating a
new one each time the function is called. This is done by giving the image a unique name for the
calling cell. If you perform multiple plots from the same function you will need to pass a name
for each to the plot function.
See Plotting Settings for the config options available to customize how the plot function
behaves.
The plot function when called from anywhere other than a worksheet function will always
add a new image to the Excel workbook. By default, the location of the image will be just underneath
the currently selected cell.
If you want to replace an existing image rather than add a new one, use the name argument to
plot and when plotting an image with the same name multiple times the existing image in Excel
will be replaced instead of creating a new one.
Interactive HTML plots [1] use a special web control widget. To move or resize these plots your first
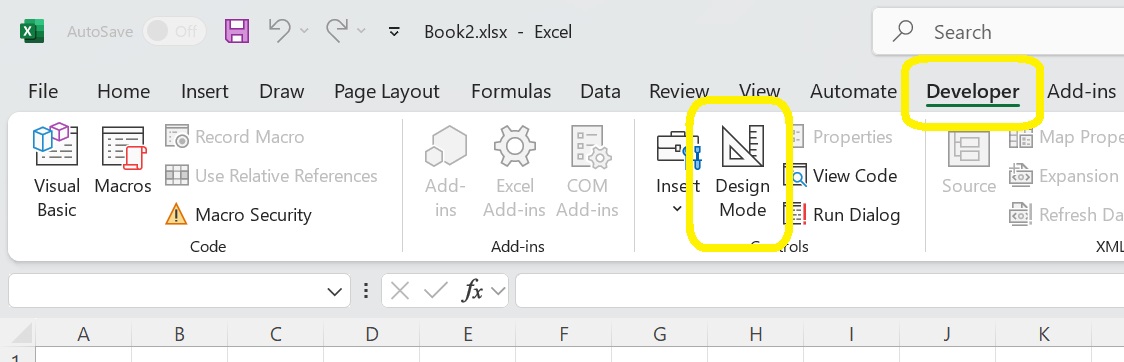
need to enable Design Mode.
To enable Design Mode, go to the Developer tab in the Excel ribbon and select Design Mode.
Whilst in Design Mode a bitmap preview will be displayed instead of the web control. You can now move
and resize this shape. There may be some lag between resizing the preview image and the preview image
updating.
To return to the interactive web widget, unselect Design Mode.
Other plot types use a Picture shape, which can be moved and resized without entering Design Mode.
New in PyXLL 5.7
After resizing a plot in Excel, when you change the selection to something else (e.g. click off the plot and into another cell) the figure will be redrawn to the new size of the image displayed in Excel.
This can be disabled by passing allow_resize=False to the plot function, or by setting
the following in your pyxll.cfg file
[PYXLL]
plot_auto_resize = 0
The above only applies for plots that render as a static image and not as an interactive HTML plot.
Footnotes