Good charts make a spreadsheet. Excel has its own charts and pivot charts, but have you ever wished you could have properly “fancy” charts in your spreadsheet like you see on modern websites?
Highcharts is a professional javascript charting package for creating interactive charts for websites. This blog shows how you can embed these same charts into Excel. We’ll cover plotting data both from an Excel spreadsheet and from external sources.
Note: Highcharts is a commercial product and requires a license for non-commercial use. See https://shop.highcharts.com/ for licensing information.
All the code related to this blog post can be found in the highcharts folder in the PyXLL examples github repo.
Related: Plotting in Excel with Python and Matplotlib and Plotting with Matplotlib Part 2
Table of Contents
A Web Browser in Excel
Since Highcharts is a javascript library, we’ll need a web browser capable of rendering the charts in Excel. Fortunately Excel already has exactly that!
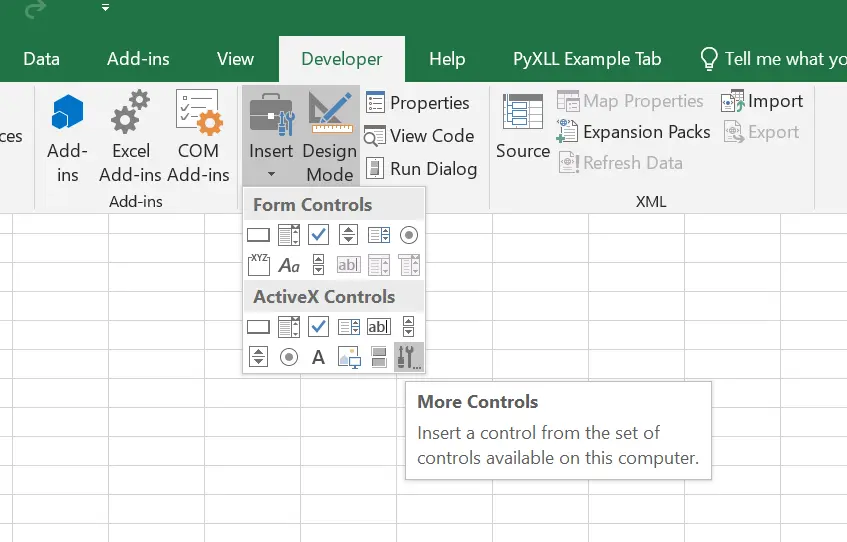
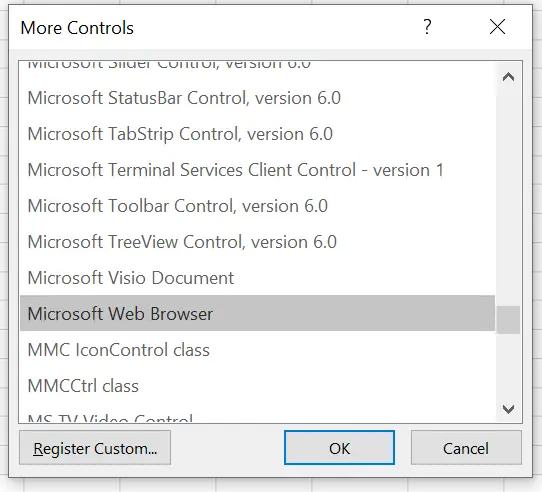
Under the “Developer” tab, go to “Insert” and select “More Controls”. This will bring up a list of other controls. Find the one called “Microsoft Web Browser”. That’s the control we’ll use to host our interactive chart.
When you try and add the Web Browser control, if you’re using Excel 2013 or newer you may run into a problem. This is because by default the Web Browser control has been disabled in Excel. However, it can easily be re-enabled with a registry setting.
You can read about why the Web Browser control is disabled by default here https://support.microsoft.com/en-us/help/4058123/security-settings-for-com-objects-in-office. That page also covers in more detail how you can enable the control.
To enable the Web Browser control, first of all open “regedit” by clicking the start menu and typing “regedit”. Find the following key in the registry:
For Office 2013 and Office 2010:
- For 64 bit Office on 64 bit Windows (or 32 bit Office on 32 bit Windows).
HKEY_LOCAL_MACHINE\Software\Microsoft\Office\Common\COM Compatibility\{8856F961-340A-11D0-A96B-00C04FD705A2} - For 32 bit Office on 64 bit Windows.
HKEY_LOCAL_MACHINE\Software\Wow6432Node\Microsoft\Office\Common\COM Compatibility\
{8856F961-340A-11D0-A96B-00C04FD705A2}
For Office 2016:
- For 64 bit Office on 64 bit Windows (or 32 bit Office on 32 bit Windows).
HKEY_LOCAL_MACHINE\Software\Microsoft\Office\16.0\Common\COM Compatibility\
{8856F961-340A-11D0-A96B-00C04FD705A2} - For 32 bit Office on 64 bit Windows.
HKEY_LOCAL_MACHINE\Software\Wow6432Node\Microsoft\Office\16.0\Common\COM Compatibility
{8856F961-340A-11D0-A96B-00C04FD705A2} }
If the Web Browser control has been disabled, you will see a subkey called Compatibility Flags with its value set to 0x00000400. Either delete this key or set its value to 0 to enable the control.
Generating the HTML for a Chart
There are a few different Python packages that will generate Highcharts HTML. For this post we’ll use python-highcharts (https://github.com/kyper-data/python-highcharts) which can be installed using pip:
pip install python-highchartsUsing PyXLL, we can call a Python function from Excel. The following function takes a 2d array of data and constructs a Highchart object. It then writes that out to an html file.
from pyxll import xl_func
from highcharts import Highchart

@xl_func
def hc_basic_line(data, filename):
    H = Highchart()

    # transform the data from a list of rows to a list of columns
    data_t = list(zip(*data))

    # add the data to the chart
    for i, series in enumerate(data_t):
        H.add_data_set(series,
                       series_type='line',
                       name="series_%d" % i)

    # write out the html
    with open(filename, "wt") as fh:
        fh.write(H.htmlcontent)

    return True
By adding this code to a new module and adding that module to our pyxll.cfg file, the function can be called from Excel. It doesn’t actually add the chart to Excel yet, it only writes out an html file.
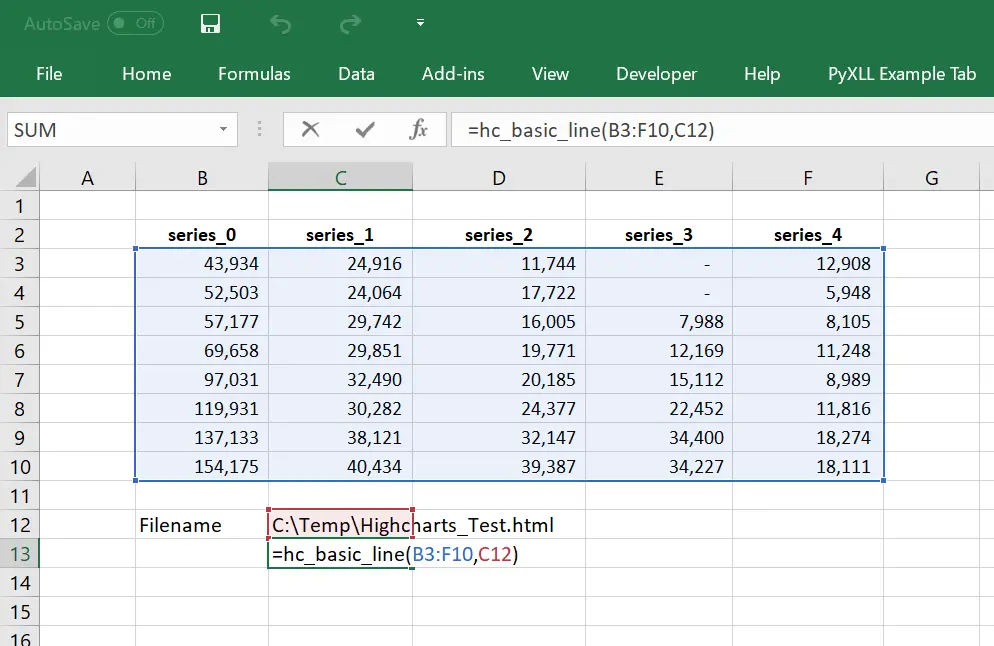
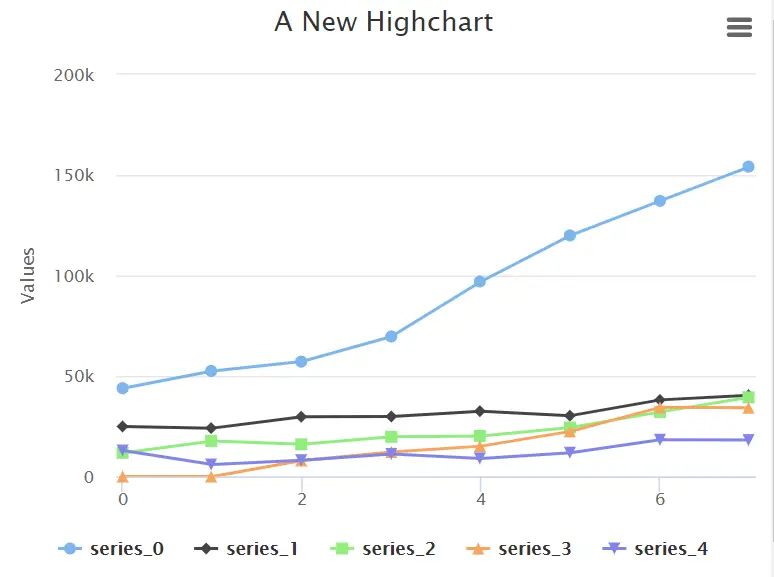
Opening the resulting html file in a browser reveals that it has created a plot of the data from the sheet, as we expected.
Adding the HTML Chart to Excel
Now we’ve got everything we need to add an interactive Highchart to Excel. Earlier we saw how to add a Web Browser control to an Excel sheet, and in the previous section we generated an HTML chart. The next step is to tie the two together so we can have our chart embedded in the Excel sheet.
If you haven’t already, add a Web Browser control to your sheet. By default, it will be named “WebBrowser1”. We’ll stick with that name for now, but later we’ll see how to change it.
In our function that generates the HTML file, we can find the Web Browser object and tell it to navigate to our generated file as follows.
from pyxll import xl_func, xl_app
from highcharts import Highchart

@xl_func
def hc_basic_line(data, filename):
    H = Highchart()

    # transform the data from a list of rows to a list of columns
    data_t = list(zip(*data))

    # add the data to the chart
    for i, series in enumerate(data_t):
        H.add_data_set(series, series_type='line', name="series_%d" % i)

    # write out the html
    with open(filename, "wt") as fh:
        fh.write(H.htmlcontent)

    xl = xl_app()
    control = xl.ActiveSheet.OLEObjects("WebBrowser1")
    browser = control.Object
    browser.Navigate("file://" + filename)

    return True
Above, we’re using PyXLL’s “xl_app” function to get the “Excel.Application” object. This is Excel’s COM interface, which has exactly the same API as Excel’s VBA object model.
When you run the above code, you might find that the Web Browser control just says “Loading…”. There are a couple of reasons for this that we will have to fix.
Problem 1: Trust Settings
Content might be restricted by your trust and privacy settings. Toggle out of “Developer Mode” in the “Developer” menu in Excel. If you see a yellow bar at the top of the browser saying “To help protect your security…” then the javascript has been blocked from being run. Click on the yellow bar and select “Allow Blocked Content”.
To avoid this warning, you would have to host the html file on a webserver. This could be running on http://localhost with a Python webserver running in the Excel process, using PyXLL.
You might also find that ActiveX controls are blocked from being used in Excel. If that’s the case, you’ll need to enable them in Excel. You should be careful when doing this that you are not violating your company’s IT policy as it could potentially be a security vulnerability. To change your ActiveX settings in the Excel Trust Center:
- Go to File > Options.
- Click Trust Center > Trust Center Settings > ActiveX Settings.
Problem 2: Browser Compatibility
When you get the javascript to run after trusting the content, you may then get a “Script Error”.
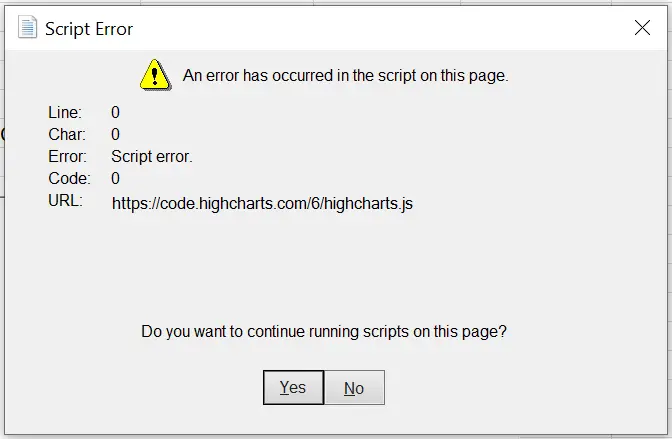
The reason you might see this error is that by default, the Web Browser control runs in Internet Explorer 7 compatibility mode. Fortunately, this is easy enough to work around. We just need to add a meta tag to the html document to tell the control to use the latest version of IE.
<meta http-equiv="X-UA-Compatible" content="IE=edge" />The easiest way I found to add this meta tag to the Highcharts html document was to parse it using BeautifulSoup and add the tag that way. You can install BeautifySoup using pip.
pip install beautifulsoup4
from pyxll import xl_func, xl_app
from highcharts import Highchart
from bs4 import BeautifulSoup

@xl_func
def hc_basic_line(data, filename):
    H = Highchart()

    # transform the data from a list of rows to a list of columns
    data_t = list(zip(*data))

    # add the data to the chart
    for i, series in enumerate(data_t):
        H.add_data_set(series, series_type='line', name="series_%d" % i)

    # get the html and add the 'X-UA-Compatible' meta-tag
    soup = BeautifulSoup(H.htmlcontent)
    metatag = soup.new_tag("meta")
    metatag.attrs["http-equiv"] = "X-UA-Compatible"
    metatag.attrs['content'] = "IE=edge"
    soup.head.insert(0, metatag)

    # write out the html
    with open(filename, "wt") as fh:
        fh.write(soup.prettify())

    xl = xl_app()
    control = xl.ActiveSheet.OLEObjects("WebBrowser1")
    browser = control.Object
    browser.Navigate("file://" + filename)

    return True
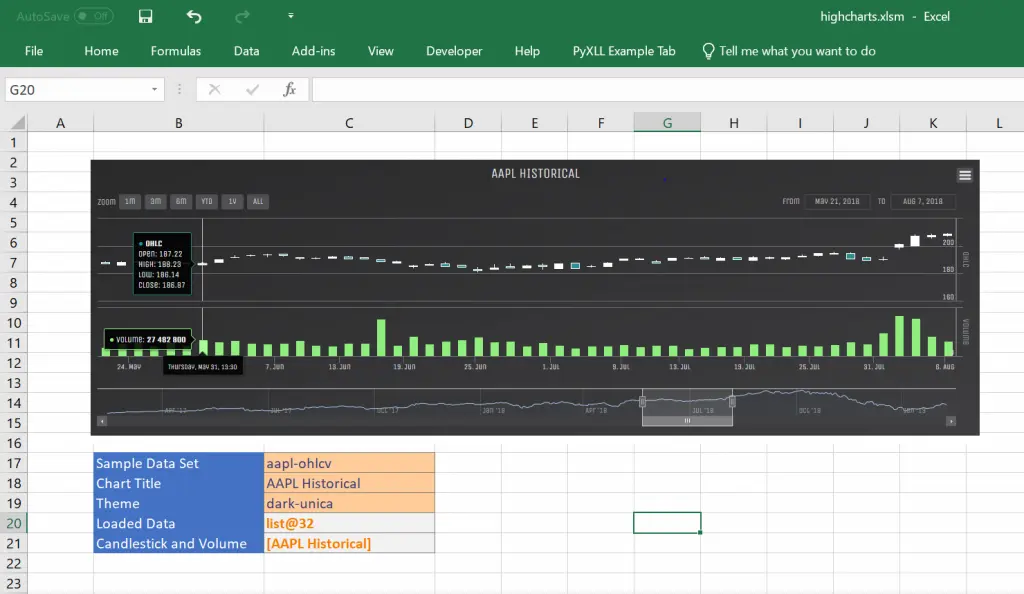
Highcharts Working in Excel

After addressing the problems of the trust settings and the browser compatibility, we now have a chart rendered using Highcharts in Excel!
Refactoring for Re-use
So far we’ve demonstrated that it is possible to embed Highcharts in Excel using PyXLL and the Web Browser control. There are a few problems with the current code, however.
- We can’t re-use this code for other functions to plot charts.
- It only works if there’s a Web Browser control called “WebBrowser1”.
- It expects the sheet the function is on to be the current active sheet.
- The chart isn’t always sized correctly.
- The html files aren’t cleaned up.
Let’s pull out the part of the function that handles writing out the html file and updating the Web Browser control into a separate function and address these problems.
1. Refactor the plotting function for re-use
We’ll start by splitting out just the part of the code that generates the html and displays it in Excel. Then we can focus on that new function to address the remaining improvements.
from pyxll import xl_func, xl_app
from highcharts import Highchart
from bs4 import BeautifulSoup

@xl_func
def hc_basic_line(data, filename):
    H = Highchart()

    # transform the data from a list of rows to a list of columns
    data_t = list(zip(*data))

    # add the data to the chart
    for i, series in enumerate(data_t):
        H.add_data_set(series, series_type='line', name="series_%d" % i)

    return hc_plot(H, filename)


def hc_plot(chart, filename):
    # get the html and add the 'X-UA-Compatible' meta-tag
    soup = BeautifulSoup(chart.htmlcontent)
    metatag = soup.new_tag("meta")
    metatag.attrs["http-equiv"] = "X-UA-Compatible"
    metatag.attrs['content'] = "IE=edge"
    soup.head.insert(0, metatag)

    # write out the html
    with open(filename, "wt") as fh:
        fh.write(soup.prettify())

    xl = xl_app()
    control = xl.ActiveSheet.OLEObjects("WebBrowser1")
    browser = control.Object
    browser.Navigate("file://" + filename)

    return True
2. Use a named control instead of “WebBrowser1”
Rather than assume the Web Browser control is always called “WebBrowser1”, we add the control name as a parameter. Also, rather than fail if the named control can’t be found, create a new browser control. This helps when adding new charts so we don’t have to set up a browser control manually each time.
def hc_plot(chart, filename, control_name="WebBrowser1"):
    # get the html and add the 'X-UA-Compatible' meta-tag
    soup = BeautifulSoup(chart.htmlcontent)
    metatag = soup.new_tag("meta")
    metatag.attrs["http-equiv"] = "X-UA-Compatible"
    metatag.attrs['content'] = "IE=edge"
    soup.head.insert(0, metatag)

    # write out the html
    with open(filename, "wt") as fh:
        fh.write(soup.prettify())

    # find the existing webbrowser control, or create a new one
    xl = xl_app()
    sheet = xl.ActiveSheet

    try:
        control = sheet.OLEObjects(control_name[:31])
        browser = control.Object
    except:
        control = sheet.OLEObjects().Add(ClassType="Shell.Explorer.2",
                                         Left=147,
                                         Top=60.75,
                                         Width=400,
                                         Height=400)
        control.Name = control_name[:31]
        browser = control.Object

    browser.Navigate("file://" + filename)

    return True
3. Get the sheet the function is called from
When recalculating a workbook containing multiple sheets, the active sheet isn’t always the right one to use. Instead the PyXLL function “xlfCaller” can be used to get the sheet that’s calling the function. Assuming the function is on the same sheet we want the chart, this will work better than always using the active sheet.
from pyxll import xlfCaller
import re

def get_calling_sheet():
    caller = xlfCaller()
    sheet_name = caller.sheet_name

    # split into workbook and sheet name
    match = re.match("^\[(.+?)\](.*)$", sheet_name.strip("'\""))
    if not match:
        raise Exception("Unexpected sheet name '%s'" % sheet_name)
    workbook, sheet = match.groups()

    # get the Worksheet object
    xl = xl_app()
    workbook = xl.Workbooks(workbook)
    return workbook.Sheets(sheet)
4. Resize the chart to fit the web browser
The highcharts charts will automatically resize to match the size of the Web Browser control. However, the default aspect ratio used won’t match the aspect ratio of the browser control. That can be fixed by setting the chart.height or chart.width option to a percentage string. Below, the height or width percentage is calculated from the control size.
def hc_plot(chart, filename, control_name="WebBrowser1"):
    # find the existing webbrowser control, or create a new one
    sheet = get_calling_sheet()
    try:
        control = sheet.OLEObjects(control_name[:31])
        browser = control.Object
    except:
        control = sheet.OLEObjects().Add(ClassType="Shell.Explorer.2",
                                         Left=147,
                                         Top=60.75,
                                         Width=400,
                                         Height=400)
        control.Name = control_name[:31]
        browser = control.Object

    # set the chart aspect ratio to match the browser
    if control.Width > control.Height:
        chart.set_options("chart", {
             "height": "%d%%" % (100. * control.Height / control.Width)
         })
    else:
        chart.set_options("chart", {
             "width": "%d%%" % (100. * control.Width / control.Height)
         })

    # get the html and add the 'X-UA-Compatible' meta-tag
    soup = BeautifulSoup(chart.htmlcontent)
    metatag = soup.new_tag("meta")
    metatag.attrs["http-equiv"] = "X-UA-Compatible"
    metatag.attrs['content'] = "IE=edge"
    soup.head.insert(0, metatag)

    # write out the html
    with open(filename, "wt") as fh:
        fh.write(soup.prettify())

    browser.Navigate("file://" + filename)

    return True
5. Use a temporary HTML file
Expecting the user to pass in a filename to plot a chart in Excel is counter-intuitive. The fact that a file is used is just an internal implementation detail. This detail could be hidden from the user so all they see is the chart in Excel without having to know about any files.
The Python tempfile package is a convenient way to create temporary file. We need it to be named so that the web browser can load it. It can’t be deleted immediately as it takes a second for the web browser to load the file. Instead we use the timer module (part of the pywin32 package) to delete the file after a few seconds.
import tempfile
import timer
import os

def render_html(browser, html):
    # Create a temporary file to write to
    fh = tempfile.NamedTemporaryFile("wt", suffix=".html", delete=False)
    filename = fh.name

    # Clean up the file after 10 seconds to give the browser time to load
    def on_timer(timer_id, time):
        timer.kill_timer(timer_id)
        os.unlink(filename)
    timer.set_timer(10000, on_timer)

    fh.write(html)
    fh.close()

    # Navigate to the temporary file
    browser.Navigate("file://%s" % filename)
Putting it all together: The complete “hc_plot” function
This hc_plot function can be used from any PyXLL @xl_func function to create or update a highcharts plot, embedded in Excel.
from pyxll import xl_app, xlfCaller
from bs4 import BeautifulSoup
import tempfile
import timer
import os
import re


def hc_plot(chart, control_name):
    # find the existing webbrowser control, or create a new one
    sheet = get_calling_sheet()
    try:
        control = sheet.OLEObjects(control_name[:31])
        browser = control.Object
    except:
        control = sheet.OLEObjects().Add(ClassType="Shell.Explorer.2",
                                         Left=147,
                                         Top=60.75,
                                         Width=400,
                                         Height=400)
        control.Name = control_name[:31]
        browser = control.Object

    # set the chart aspect ratio to match the browser
    if control.Width > control.Height:
        chart.set_options("chart", {
             "height": "%d%%" % (100. * control.Height / control.Width)
         })
    else:
        chart.set_options("chart", {
             "width": "%d%%" % (100. * control.Width / control.Height)
         })

    # get the html and add the 'X-UA-Compatible' meta-tag
    soup = BeautifulSoup(chart.htmlcontent)
    metatag = soup.new_tag("meta")
    metatag.attrs["http-equiv"] = "X-UA-Compatible"
    metatag.attrs['content'] = "IE=edge"
    soup.head.insert(0, metatag)

    # write out the html
    render_html(browser, soup.prettify())


def get_calling_sheet():
    # get the calling sheet
    caller = xlfCaller()
    sheet_name = caller.sheet_name

    # split into workbook and sheet name
    match = re.match("^\[(.+?)\](.*)$", sheet_name.strip("'\""))
    if not match:
        raise Exception("Unexpected sheet name '%s'" % sheet_name)
    workbook, sheet = match.groups()

    # get the Worksheet object
    xl = xl_app()
    workbook = xl.Workbooks(workbook)
    return workbook.Sheets(sheet)


def render_html(browser, html):
    # Create a temporary file to write to
    fh = tempfile.NamedTemporaryFile("wt", suffix=".html", delete=False)
    filename = fh.name

    # Clean up the file after 10 seconds to give the browser time to load
    def on_timer(timer_id, time):
        timer.kill_timer(timer_id)
        os.unlink(filename)
    timer.set_timer(10000, on_timer)

    fh.write(html)
    fh.close()

    # Navigate to the temporary file
    browser.Navigate("file://%s" % filename)
This hc_plot function can now be called from our previous hc_basic_line function.
@xl_func
def hc_basic_line(data, title):
    H = Highchart()

    H.set_options("title", {
        "text": title
    })

    # transform the data from a list of rows to a list of columns
    data_t = list(zip(*data))

    # add the data to the chart
    for i, series in enumerate(data_t):
        H.add_data_set(series, series_type='line', name="series_%d" % i)

    # plot the chart in Excel, using the chart title as the control name
    hc_plot(H, title)

    return True
Handling Larger Data Sets
Highcharts are great for interactive data visualisation that is hard to match with Excel’s charts. They are capable of rendering large data sets, and sometimes it’s not convenient or practical to pull so much data into an Excel sheet.
PyXLL can pass Python objects around using object handles. This can be used to load large arrays into Python and pass them between functions without having to unpack them in Excel. You can read more about cached Python objects in the PyXLL user guide.
For really large data sets, you may even want to serve the data via a web server directly to your highcharts instead of loading the data in Python.
The following function loads a sample data set from highcharts.com.
from pyxll import xl_func
from highcharts.highstock.highstock_helper import jsonp_loader

@xl_func("string: object")
def hc_load_sample_data(name):
    url = "https://www.highcharts.com/samples/data/jsonp.php?filename=%s.json&callback=?" % name
    return jsonp_loader(url)
The returned object from this function can be passed to another plotting function to plot the data.
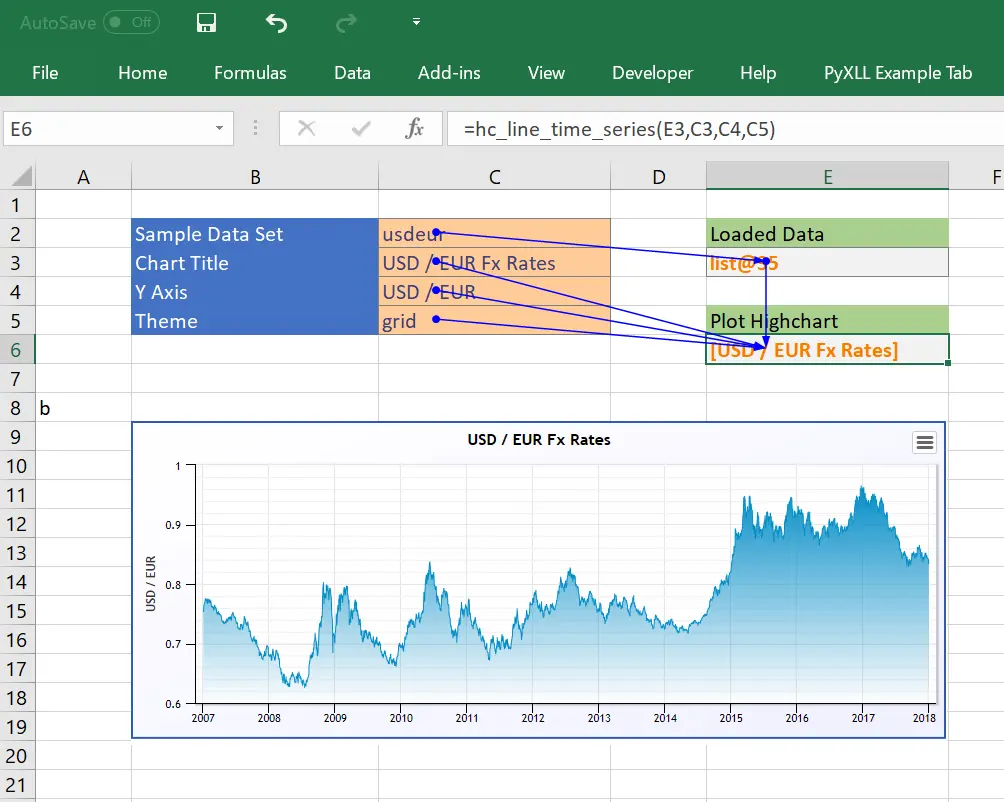
Here the data is loaded using hc_load_sample_data and passed to hc_line_time_series. The source code for these functions can be found in highcharts folder in the PyXLL examples github repo.