Wow! It’s been a long time since I wrote Plotting in Excel with Python and Matplotlib – #2. A lot has changed since then and this Part 3 post is long over-due!
I you have followed the previous two blog posts then everything contained there will still work. But, with updates to the PyXLL add-in since those posts were written everything is now a lot easier.
Python Excel integration with PyXLL makes getting your matplotlib charts (as well as others, including seaborn, plotly and bokeh) into Excel easy. You create your chart in exactly the same way you would normally, and then call pyxll.plot to display the Python plot directly in Excel.
All of the code from this post is available here https://github.com/pyxll/pyxll-examples/tree/master/matplotlib
Table of Contents
Embedding Python Charts in the Excel workbook
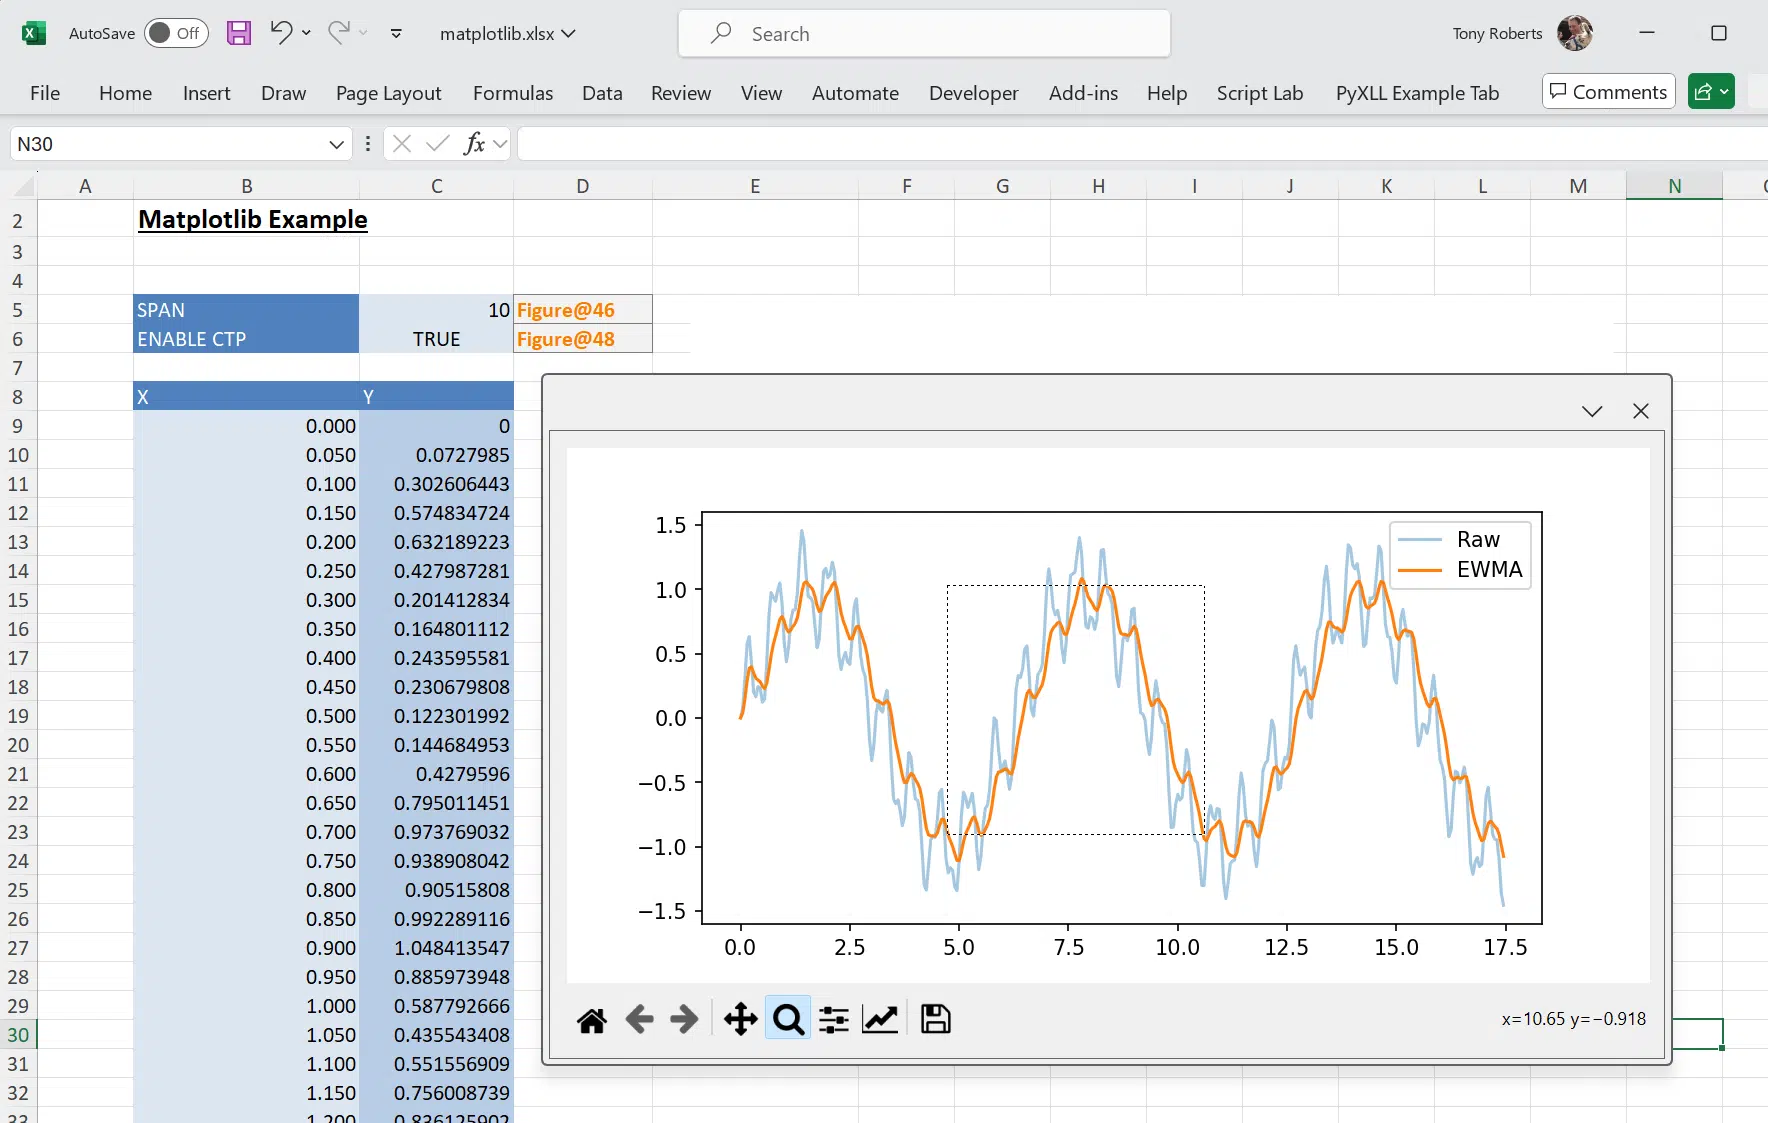
In part 2 of this series we looked at a function that created a matplotlib chart. We then embedded that into Excel as a Picture object using the pywin32 package. Our function took a series of x and y values, calculated a moving average, and then plot those using matplotlib.
The following function does the same (with a couple of updates as pandas has also changed in the interim!). But, instead of exporting the chart as an image and then adding it into Excel as a Picture object using pywin32, now we call pyxll.plot instead.
from pyxll import xl_func, plot
import pandas as pd
from matplotlib import pyplot as plt


@xl_func("numpy_column<float> xs, numpy_column<float> ys, int span: object")
def mpl_plot_ewma(xs, ys, span):
    # create the figure and axes for the plot
    fig, ax = plt.subplots()

    # calculate the moving average
    moving_average = pd.Series(ys, index=xs).ewm(span=span).mean()

    # plot the data
    ax.plot(xs, ys, alpha=0.4, label="Raw")
    ax.plot(xs, moving_average.values, label="EWMA")
    ax.legend()

    # Show the figure in Excel
    plot(fig)

    # Return the figure as an object
    return fig
Using pyxll.plot save a lot of tedious Python code to get the chart into Excel. It also produces a better result! Instead of exporting a bitmap image, in newer versions of Excel it can use a vector image. This results in a better image quality. Resizing also works, redrawing the matplotlib figure after each time you resize the Excel object.
Interactive Python Charts in Excel
In Part 1 we looked at how to display an interactive matplotlib window from Excel. That has also become a lot simpler since PyXLL introduced Custom Task Panes (or CTP for short). CTPs are native Excel windows that can be floating or docked. PyXLL can host a variety of Python UI toolkit window types in CTPs, including PyQt (which is what we used in Part 1).
As before, we can create a matplotlib canvas using the PyQt backend. This time however, rather than worrying about the Qt message loop, we can let PyXLL do the hard work!
The following worksheet function takes a Figure object (like the one returned by the function above). It then adds it to canvas using the matplotlib Qt backend and uses pyxll.create_ctp to display it in Excel.
from pyxll import xl_func, create_ctp, CTPDockPositionFloating
from matplotlib.backends.backend_qtagg import FigureCanvasQTAgg as FigureCanvas
from matplotlib.backends.backend_qtagg import NavigationToolbar2QT as NavigationToolbar
from PySide6.QtWidgets import QWidget, QVBoxLayout, QApplication


@xl_func
def show_matplotlib_ctp(fig):
    # Before we can create a Qt widget the Qt App must have been initialized.
    # Make sure we keep a reference to this until create_ctp is called.
    app = QApplication.instance()
    if app is None:
        app = QApplication([])

    # Create the widget and a layout for it
    widget = QWidget()
    layout = QVBoxLayout(widget)
    widget.setLayout(layout)

    # Add the matplotlib plot to the window
    canvas = FigureCanvas(fig)
    layout.addWidget(canvas)

    # And add a toolbar
    toolbar = NavigationToolbar(canvas)
    layout.addWidget(toolbar)

    # Create the CTP to show the widget in Excel
    create_ctp(widget, width=800, height=800, position=CTPDockPositionFloating)
This now gives us a fully interactive matplotlib window, directly in Excel! We can zoom and pan interactively and access all the features of the usual matplotlib interface. Using pyxll.create_ctp is make this much easier before. Unlike previously, the window is now a native Excel window and can be docked wherever we want it.
Improved Interactive Python Charts in Excel
The code in the section above has a problem. Whenever the function is called a new CTP is created. This is probably not what you would want!
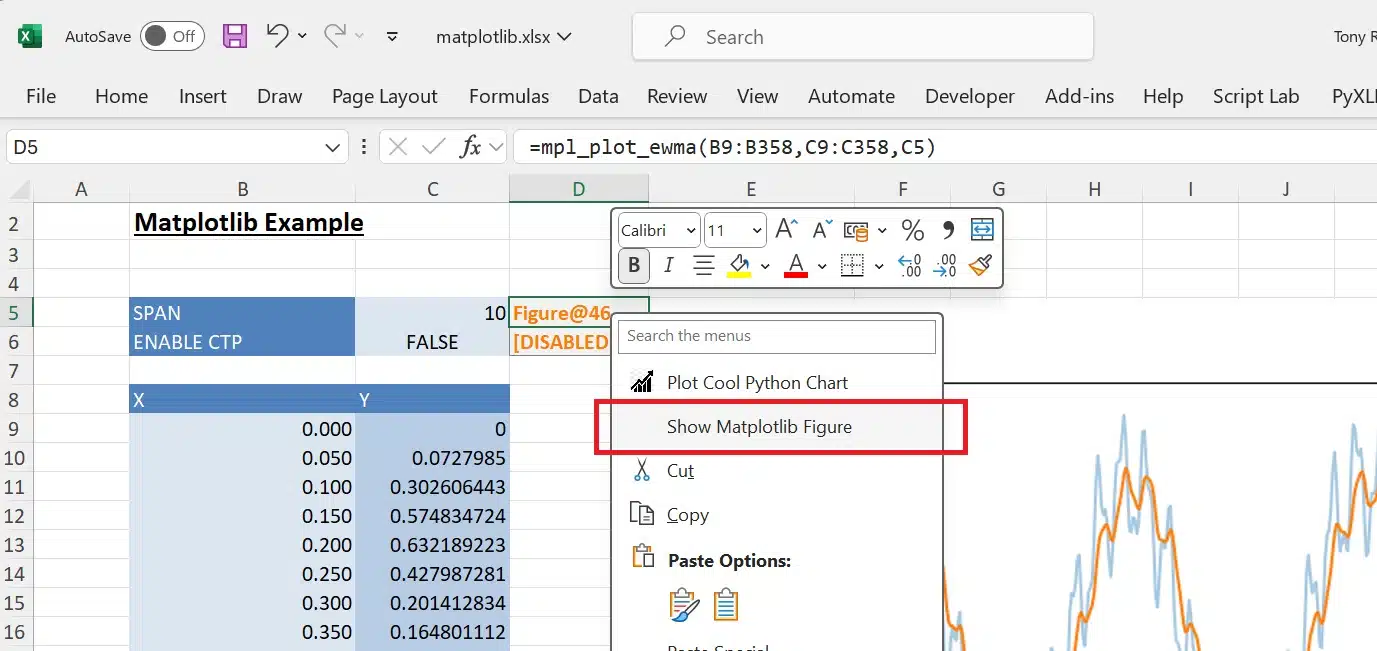
To solve this problem, one solution is to use a right click context menu instead of a worksheet function. It’s possible to add your own Python function’s to Excel’s context menu. We can use that to pop up the CTP from a context menu item instead of from a worksheet function. This avoids the problem of the CTP being created each time the worksheet recalculates.
Creating context menu items is very similar to configuring the Excel ribbon toolbars. First we write a function that will be called when the menu item is selected. This will be almost identical to our function above. Instead of being passed the Figure object, it’s passed a ribbon control object. To get the Figure we have to get it from the current selection. Everything else from then is the same as before.
def show_selected_matplotlib_ctp(control):
    # Get the Excel application object
    xl = xl_app()

    # Get the current and check if it as a matplotlib Figure
    cell = XLCell.from_range(xl.Selection)
    fig = cell.options(type="object").value

    if not isinstance(fig, Figure):
        raise ValueError("Expected a matplotlib Figure object")

    # Before we can create a Qt widget the Qt App must have been initialized.
    # Make sure we keep a reference to this until create_ctp is called.
    app = QApplication.instance()
    if app is None:
        app = QApplication([])

    # Create the widget and a layout for it
    widget = QWidget()
    layout = QVBoxLayout(widget)
    widget.setLayout(layout)

    # Add the matplotlib plot to the window
    canvas = FigureCanvas(fig)
    widget.layout().addWidget(canvas)

    # And add a toolbar
    toolbar = NavigationToolbar(canvas)
    widget.layout().addWidget(toolbar)

    # Show as a custom task pane using PyXLL.create_ctp
    create_ctp(widget, width=800, height=800, position=CTPDockPositionFloating)
To add that Python function to Excel’s context menu we have to edit our ribbon.xml file and include the following. Note that the customUI xmlns must be “2009/07/customui” or later. If you have items in your “<ribbon>” section already you can add the “<contextMenus>” section afterwards. You will also need to change the “onAction” value to match your Python module and function name, if different from mine.
<?xml version="1.0" encoding="UTF-8"?>
<customUI xmlns="http://schemas.microsoft.com/office/2009/07/customui">
    <ribbon>
    </ribbon>
    <contextMenus>
        <contextMenu idMso="ContextMenuCell">
            <button id="MplShowPlot" label="Show Matplotlib Figure"
                onAction="interactiveplot.show_selected_matplotlib_ctp"/>
        </contextMenu>
   </contextMenus>
</customUI>
With that added and the PyXLL add-in reloaded, you will now see “Show Matplotlib Figure” when you right click on a cell. Selecting that on the cell where the Figure object was returned previously will open a new CTP with that figure!
Even More Improved Python Charts in Excel!
The first method of displaying an interactive Python chart in Excel one problem; a new CTP would be created each time the function was called. Other than that it’s quite nice as each time an input changes, the chart is redrawn.
What if the function could remember that it created a CTP previously? Then it could update that rather than create a new one.
We can do exactly that by maintaining a cache of QWidget objects. The cache will be keyed by the calling cell address. Each time our function is called from the same cell, it will return the widget created previously. Then all we need to do is update that widget with the latest figure.
As we don’t want the cache to keep growing indefinitely, we’ll use a weakref.WeakValueDictionary. A WeakValueDictionary is a really useful class in Python. Unlike a normal dictionary, it doesn’t prevent a value entered into it from being destroyed. If the value is no longer referenced by anything else then the value in the dictionary is removed. This is perfect for what we need. Once the widget is no longer in use, there’s no need for us to keep it in the cache!
Here’s the updated function. To get the calling cell address we need to use pyxll.xlfCaller. We check the new _mpl_ctp_cache dictionary to see if there’s already a widget for our calling address. If there isn’t we create a new one and everything’s the same as before. If there is, we close and remove the canvas and toolbar added previously, and add the new canvas with the new figure.
from pyxll import xl_func, xlfCaller, create_ctp, schedule_call, CTPDockPositionFloating
from matplotlib.backends.backend_qtagg import FigureCanvasQTAgg as FigureCanvas
from matplotlib.backends.backend_qtagg import NavigationToolbar2QT as NavigationToolbar
from PySide6.QtWidgets import QWidget, QVBoxLayout, QApplication
from matplotlib.figure import Figure
from functools import partial
import weakref


# Dictionary of calling cell addresses to Qt widgets
_mpl_ctp_cache = weakref.WeakValueDictionary()


@xl_func("object fig, bool enabled: var", macro=True)  # macro=True is needed for xlfCaller
def show_matplotlib_ctp(fig, enabled=True):
    """Display a matplotlib Figure in a Custom Task Pane.

    This worksheet function takes a cell reference rather than
    an object directly as it keeps track of the custom task pane
    and updates it with the new figure if called again for the same
    cell.
    """
    if not enabled:
        return "[DISABLED]"

    if not isinstance(fig, Figure):
        raise ValueError("Expected a matplotlib Figure object")

    # Get the calling cell to check if there is already a visible CTP for this cell
    cell = xlfCaller()

    # Get the widget from the cache if it exists already
    widget = _mpl_ctp_cache.get(cell.address, None)
    show_ctp = True if widget is None else False
    if widget is None:
        # Before we can create a Qt widget the Qt App must have been initialized.
        # Make sure we keep a reference to this until create_ctp is called.
        app = QApplication.instance()
        if app is None:
            app = QApplication([])

        # Create the widget and a layout for it
        widget = QWidget()
        layout = QVBoxLayout(widget)
        widget.setLayout(layout)

    # Close any old widgets and remove them from the layout
    layout = widget.layout()
    while layout.count() > 0:
        child = layout.itemAt(0)
        child.widget().setParent(None)
        layout.removeItem(child)

    # Add the matplotlib plot to the window
    canvas = FigureCanvas(fig)
    layout.addWidget(canvas)

    # And add a toolbar
    toolbar = NavigationToolbar(canvas)
    layout.addWidget(toolbar)

    # Create and show the CTP if necessary.
    # We use pyxll.schedule_call to schedule creating the CTP after this function
    # has finished.
    if show_ctp:
        create_ctp_func = partial(
            create_ctp,
            widget,
            width=800,
            height=800,
            position=CTPDockPositionFloating)
        schedule_call(create_ctp_func)

    # We use a WeakValueDict so the item stays in this dict so long as the widget is alive.
    # Once the CTP is closed and the widget is destroyed then the item in the cache is
    # cleared automatically.
    _mpl_ctp_cache[cell.address] = widget

    return fig
With this function we have a fully interactive, dockable, matplotlib widget right in Excel. Whenever an input changes causing our figure to be recreated, the widget also updates!
We used pyxll.schedule_call to schedule calling create_ctp in the code above. This is because when Excel first starts up, if opening a workbook that calls this function, the function could be called before Excel is completely initialized and calling create_ctp before Excel is fully initialized will fail. Using schedule_call ensures that create_ctp doesn’t get called until Excel is ready.
