PyXLL The Python Excel Add-In
  • Product
    • Features
    • Get Started
    • Request Demo
    • Download
  • Pricing
  • Resources
    • Documentation
    • Blog
    • Videos
    • FAQ
    • Learn Python
    • Customer Portal
    • About Us
  • Support
    • Documentation
    • Videos
    • FAQ
    • Contact Us
  • Contact Us
Table of Contents
  • PyXLL Documentation
  • Introduction to PyXLL
  • User Guide
  • Video Guides and Tutorials
    • Installing the PyXLL Add-in
    • Writing Excel Functions in Python
    • Jupyter Notebooks in Excel
    • Debugging Python in Excel
    • Working with Tables
    • Monte Carlo Simulations
    • Cell Formatting
    • RTD Array Functions
    • DOOM in Excel
    • NLP VLOOKUP using Scikit Learn
    • Deploying your PyXLL Add-in
  • API Reference
  • What’s new in PyXLL 5
  • Changelog
Close

Monte Carlo Simulations

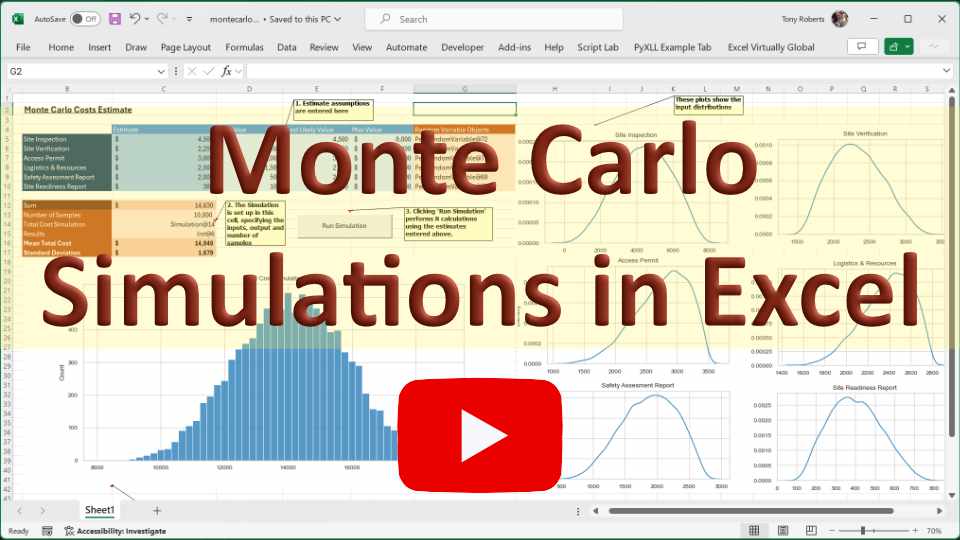
This tutorial demonstrates one way of performing Monte Carlo style simulations in Excel by setting input cells to values from random distributions and sampling the output many times.

The code accompanying this video can be found here https://github.com/pyxll/pyxll-examples/tree/master/montecarlo.

Also see Macro Functions in the user guide.

Monte Carlo Simulation in Excel
  • 00:00 - Intro

  • 00:36 - Example use case

  • 01:17 - PyXLL

  • 01:35 - Background explaination

  • 02:11 - Writing a Python Excel macro

  • 02:33 - The three point ‘PERT’ distribution

  • 03:52 - Running the macro in Excel

  • 04:18 - Writing the main Python code

  • 06:08 - Plotting the input distributions

  • 07:38 - The Monte Carlo simulation

  • 12:40 - Improving the performance

  • 15:41 - Extracting and plotting the results

  • 17:46 - Making it reusable

  • 18:58 - Wrapping up

« Working with Tables
Cell Formatting »
  • Home
  • Product
  • Features
  • Documentation
  • Download
  • Pricing
  • Support
  • Documentation
  • Videos
  • FAQ
  • Learn Python
  • Contact Us
  • About
  • About Us
  • Legal
  • Blog
© Copyright PyXLL Ltd