In this post, we are going to build a Univariate Garch model in Excel. Garch models are used to estimate the volatility of financial assets.
Building this model in VBA would be an extremely difficult task, even for people who understand VBA very well. Estimating the Univariate Garch parameters would require us to utilize the maximum log-likelihood. Especially, there is no package that is built in Excel to perform such a task.
Building such a model in Python however is straightforward, and using PyXLL we can use that Python model in Excel.
Table of Contents
Building the Garch Model in Python
We first need to write the Python code to estimate the parameters of the Garch model. The code to do that is as follows:
from arch import arch_model
import pandas

def garch_parameters(array):
   am = arch_model(array)
   res = am.fit()
   parameters = res.params
   df = pandas.DataFrame(data={"Parameters": res.params})
   return df
The following describes the steps involved in writing this code:
Installing the required depenencies
We need to install the two required packages using Pip.
- First is the arch package which will help us to estimate the Garch parameters. We can install this by running “pip install arch”. The documentation for this arch package can be found here https://arch.readthedocs.io/en/latest/.
- The second package is pandas which helps us to organize our DataFrame. If you don’t already have pandas installed you can do so by running “pip install pandas”. The documentation for pandas is here https://pandas.pydata.org/.
Writing the garch_parameters function
The name of our function is “garch_parameters”. This function will take in a list of numbers and return a pandas DataFrame containing the estimated model parameters. Typically a Garch model would take a list of returns from a financial asset, such as a stock or index.
- We create a variable called “am” which calls in the arch_model library from the arch package.
- We create another variable called “res”. This “res” variable will call the function fit() from the arch_model library from the Arch package.
- Now this “res” variable stores all the information relating to our Garch model. This includes the model parameters, predicted values, forecasted values, etc…
- We only want the parameters information in this case. Hence, we create another variable called “parameters” and set it to the “params” property from the “res” object. The “res.params” object is a pandas Series.
- After that, we create a new pandas DataFrame with a single “Parameters” column, populated with the paramaters from the model.
- Finally, we have to return the DataFrame from the “garch_parameters” function.
Testing our function
We would like to test our function to make sure that it actually works as expected.
We can do that by passing a list of numbers from 1 to 9 to the “garch_parameters” function. These numbers are meaningless but will do to test our function for now. After that, we want to print out the result from the function.
array = [1, 2, 3, 4, 5, 6, 7, 8, 9]
parameters = garch_parameters(array)
print(parameters)
The result of this is below. The first part is logging output when fitting the model, and the last part is our returned DataFrame.
Iteration:      1,   Func. Count:      6,   Neg. LLF: 20.506584350020002
Iteration:      2,   Func. Count:     11,   Neg. LLF: 20.44190810570409
Iteration:      3,   Func. Count:     16,   Neg. LLF: 20.152409978459932
Iteration:      4,   Func. Count:     21,   Neg. LLF: 20.45211420593808
Iteration:      5,   Func. Count:     27,   Neg. LLF: 20.0944858717587
Iteration:      6,   Func. Count:     32,   Neg. LLF: 20.05342532414289
Iteration:      7,   Func. Count:     37,   Neg. LLF: 20.049494048694175
Iteration:      8,   Func. Count:     42,   Neg. LLF: 20.049237484531698
Iteration:      9,   Func. Count:     47,   Neg. LLF: 20.049226996078335
Iteration:     10,   Func. Count:     52,   Neg. LLF: 20.049224914701313
Iteration:     11,   Func. Count:     56,   Neg. LLF: 20.049224940608756
Optimization terminated successfully    (Exit mode 0)
            Current function value: 20.049224914701313
            Iterations: 11
            Function evaluations: 56
            Gradient evaluations: 11

Parameters
mu	        4.419667
omega	    1.025551
alpha[1]	1.000000
beta[1]	    0.000000
Calling the Garch Model from Excel
Now that we know our Python function works, how do we use this function in an Excel environment? This is where PyXLL comes into play. PyXLL is an Excel add-in that allows us to call Python functions directly from Excel.
If you are new to PyXLL please visit https://www.pyxll.com. There you can find more information about PyXLL, including how to install and configure the add-in.
We are going to use the xl_func decorator from PyXLL. The xl_func decorator instructs the PyXLL add-in that this function is to be exposed to Excel as a worksheet function. PyXLL will export this function to Excel so we can call it from an Excel worksheet.
The video https://www.pyxll.com/docs/videos/worksheet-functions.html is a good introduction to writing Excel worksheet functions in Python using PyXLL. If you have not written a worksheet function using PyXLL before this video is a good place to start.
Exposing the Python function to Excel
To expose our “garch_parameters” function to Excel we only need to apply the xl_func decorator to the function. We must also add our Python module to the “modules” list in the “pyxll.cfg” config file (without the .py extension). You may also need to add your source folder to the “pythonpath” setting. Your source folder is the folder where you have saved your Python module.
; Your pyxll.cfg file will need to be updated
; with the location of your Python code, and the
; name of the Python module you have written
; containing the "garch_parameters" function.

[PYTHON]
pythonpath =
    ...
    C:\where\your\code\is

[PYXLL]
modules =
    ...
    your_garch_module
The xl_func decorator takes a string that tells PyXLL what arguments the function expects, and what it returns. PyXLL uses this to convert from the Excel function inputs to the Python arguments. PyXLL will apply some default conversion if we don’t specify anything, but in this case we want to be explicit.
Our decorated function looks as follows:
from pyxll import xl_func
from arch import arch_model
import pandas

@xl_func("float[]: dataframe<index=True>")
def garch_parameters(array):
   am = arch_model(array)
   res = am.fit()
   parameters = res.params
   df = pandas.DataFrame(data={"Parameters": res.params})
   return df
Our Excel function takes an array of numbers and returns a 2d array of data back to Excel. This is acheived by the function signature string passed to the xl_func decorator. The “float[]” argument means that this function will take in 1d array of numbers from Excel and pass it to our function as a list of floats. After a colon we specify the function return type, which tells PyXLL how to convert our returned value to something Excel can handle. We want PyXLL to convert the returned DataFrame, including the index, to a range of values in Excel and so we use “dataframe<index=True>” as the return type.
You can find more about how PyXLL handles argument and return types in the user guide here https://www.pyxll.com/docs/userguide/udfs/argtypes.html.
Calling the Python function from Excel
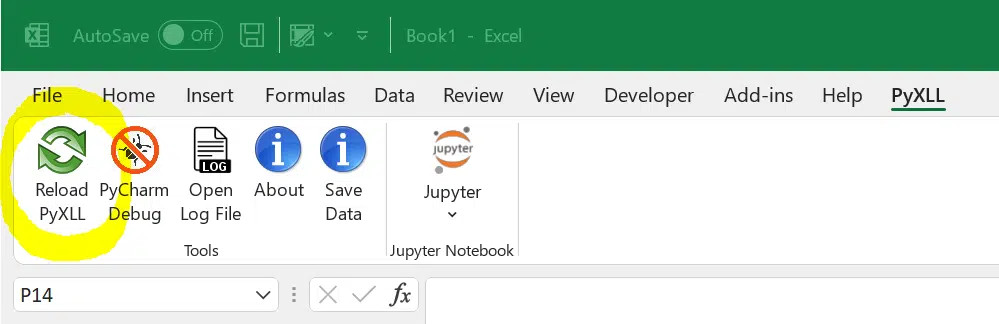
Now we can test this function in Excel. If you open Excel, this function will be automatically available in excel. If you have Excel already open you will need to reload the PyXLL add-in. Reloading PyXLL will load your Python module that you configured in the pyxll.cfg file.
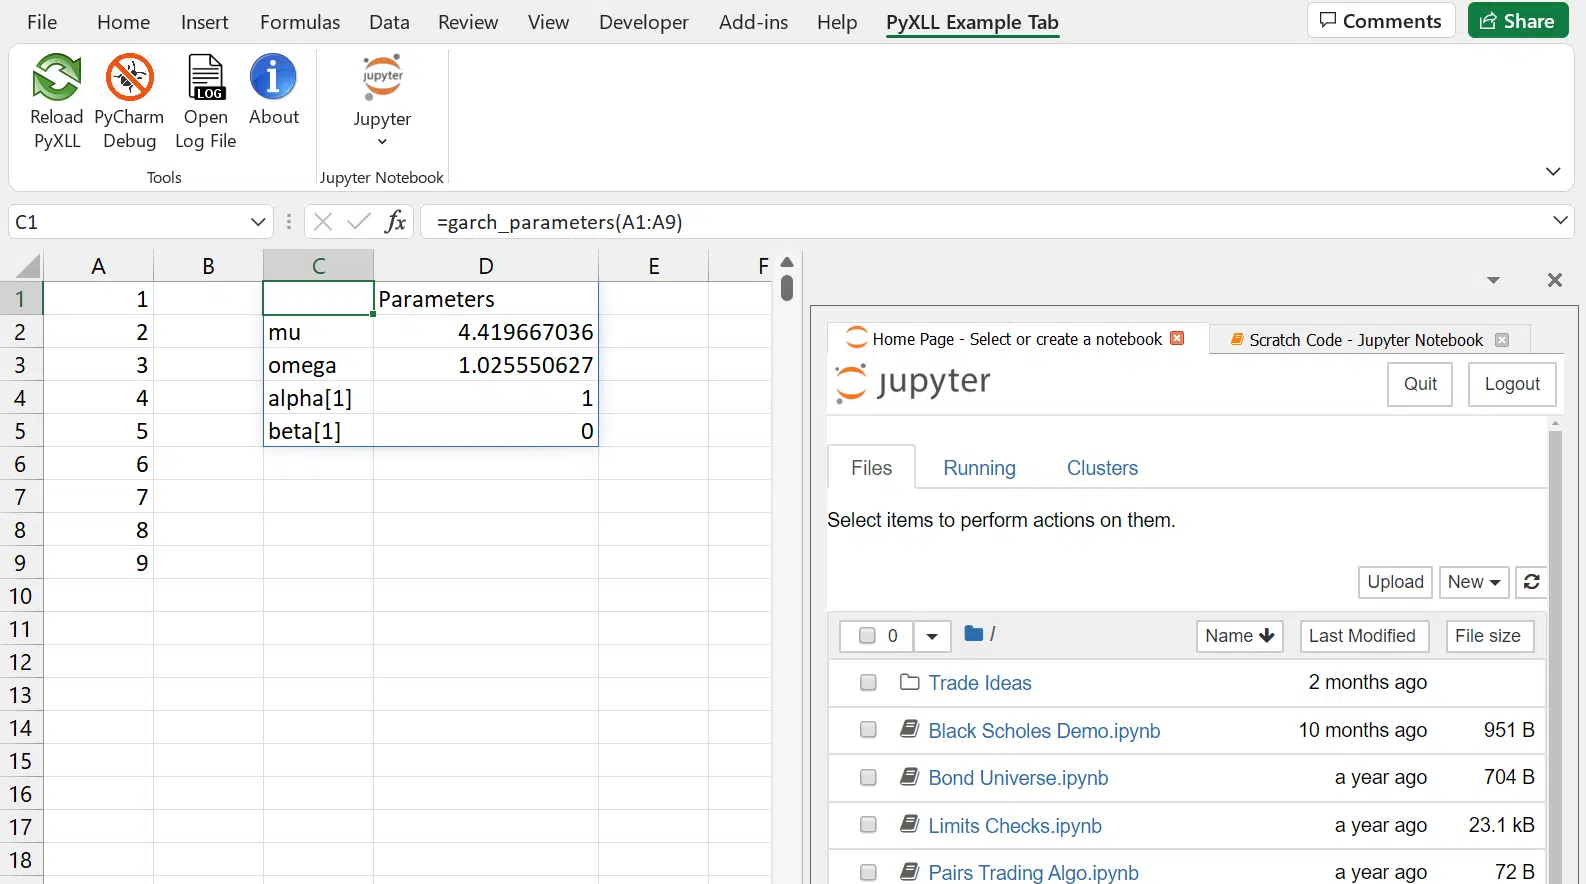
To call the function from Excel we enter “=garch_parameters(…)” and pass it an array of numbers. Using the same array of numbers we called the Python function with earlier results in the same result in Excel.

Note: If you are using an old version of Excel you may find that the array doesn’t automatically expand. Dynamic arrays are a new feature in Office 365. To automatically expand an array in older versions, pass “auto_expand=True” to the xl_func decorator. See https://www.pyxll.com/docs/userguide/udfs/arrayfuncs.html for more details about array functions.
Using a Jupyter Notebook for Python development
The next step in the process is to load the real data, and estimate the garch model based on this data. We are going to do this in a Jupyter notebook using the PyXLL-Jupyter package.
Using a Jupyter notebook allows us to quickly write Python code directly in Excel. One drawback of using a Jupyter notebook is that it won’t load automatically when starting Excel. The Jupyter notebook has to be run for our code to be available in Excel. It is useful for developing as we can iterate quickly, but for deployment moving the code to a Python module is often better.
Before we can use a Jupyter notebook in Excel we need to install the PyXLL-Jupyter package, which can be done by running:
pip install pyxll-jupyter
Once installed, reload PyXLL and you will see the Jupyter button in the PyXLL ribbon.
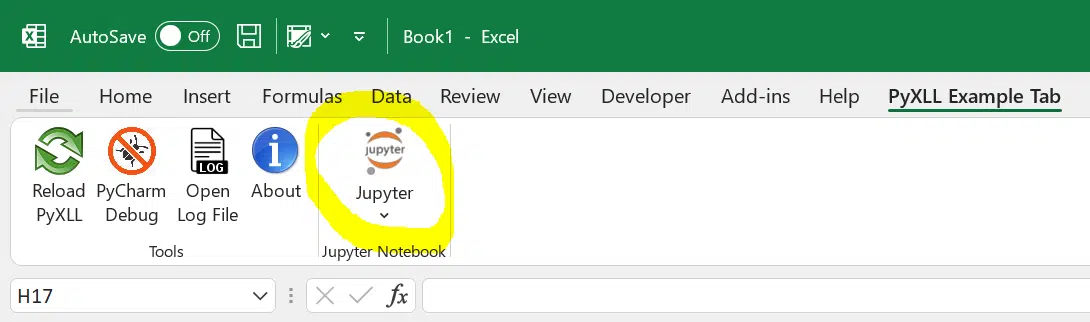
Clicking the Jupyter button opens the Jupyter notebooks application inside of Excel. For more details about how to use the PyXLL-Jupyter package please see https://www.pyxll.com/blog/python-jupyter-notebooks-in-excel/.
Using the Garch model with real data
Fetching returns data from Yahoo Finance
We’ve already tested out “garch_parameters” function with some test data. To be useful however we need some real data, which we can load from Yahoo Finance using the “pandas_datareader” package.
from pyxll import xl_func
import pandas
import datetime as dt
import pandas_datareader.data as web

@xl_func("string: dataframe<index=False>")
def data_load(symbol):
    start = dt.datetime(2000,1,1)
    end = dt.datetime(2014,1,1)
    data = web.get_data_yahoo(symbol, start=start, end=end)

    market = data["Adj Close"]
    returns = 100 * market.pct_change().dropna()
    return_val = []
    for i in returns:
        return_val.append(i)
    df = pandas.DataFrame(data={"Returns":return_val})
    return df
There are 2 additional packages that we need are datetime and pandas_datareader. The pandas_datareader package is used to load data from Yahoo Finance. The datetime package is used to specify the start and end dates that we are loading data for (ed: These dates could be passed into our function instead of hard coding them in the function).
Our new function data_load takes a string as an argument and returns a DataFrame. The string argument in this case is the symbol of stock, for instance: AAPL, IBM, etc…. The DataFrame returned contains the returns for that symbol.
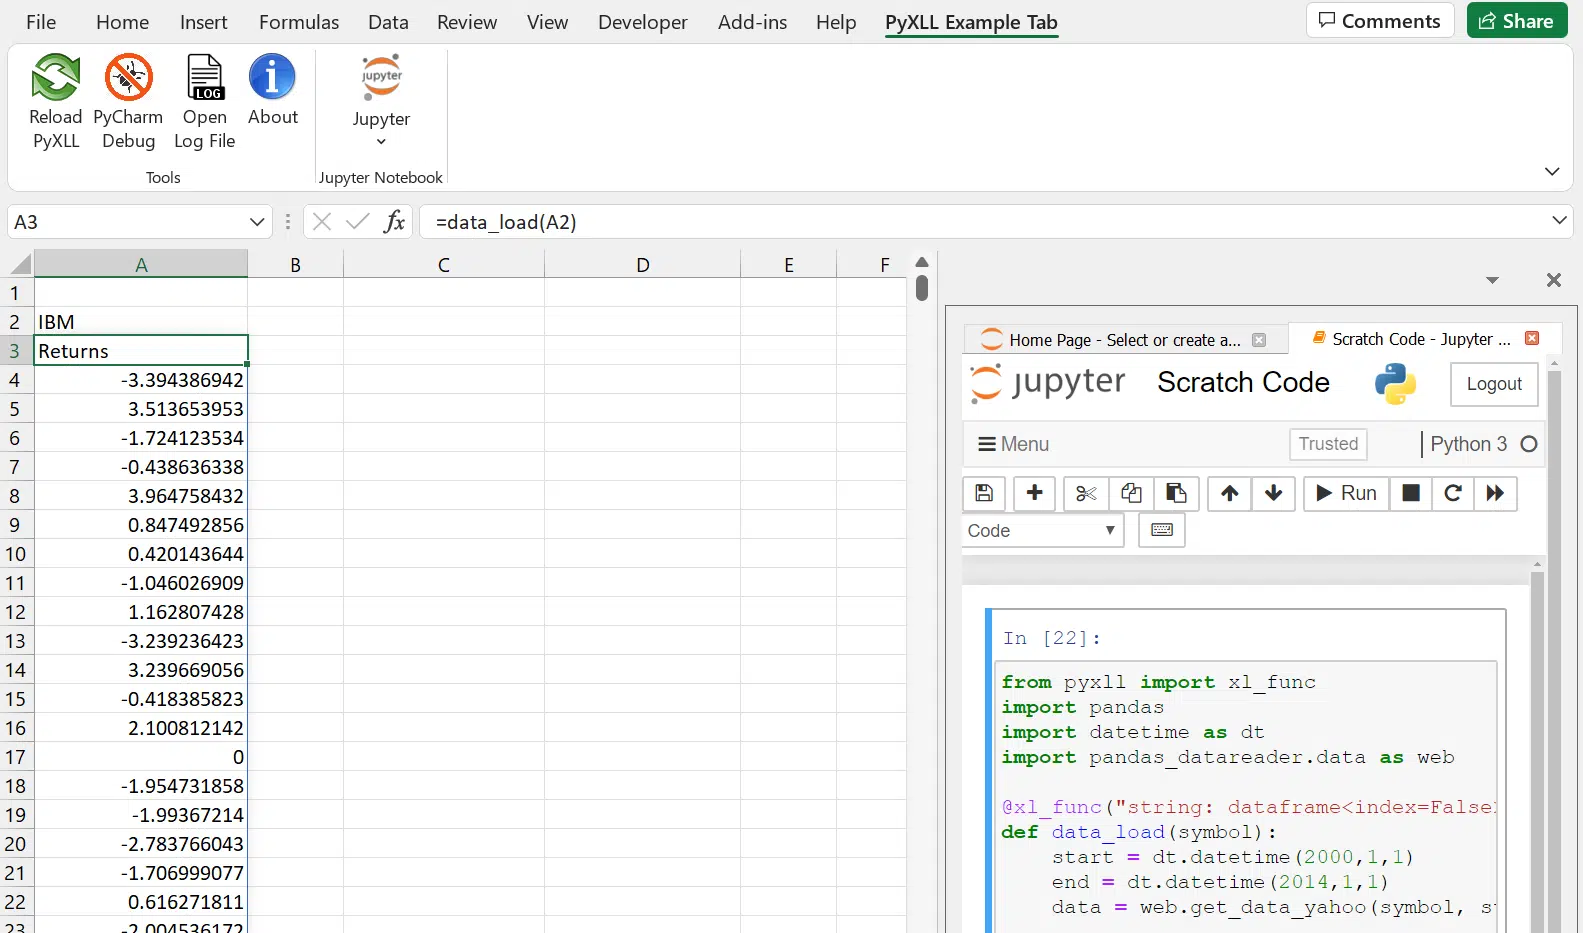
After entering the code into the Jupyter notebook and running the cell, our new “data_load” function is available to call from Excel.
Fitting the model parameters
We already have our “garch_parameters” function in Excel. We can call this using the returns we’ve just loaded!

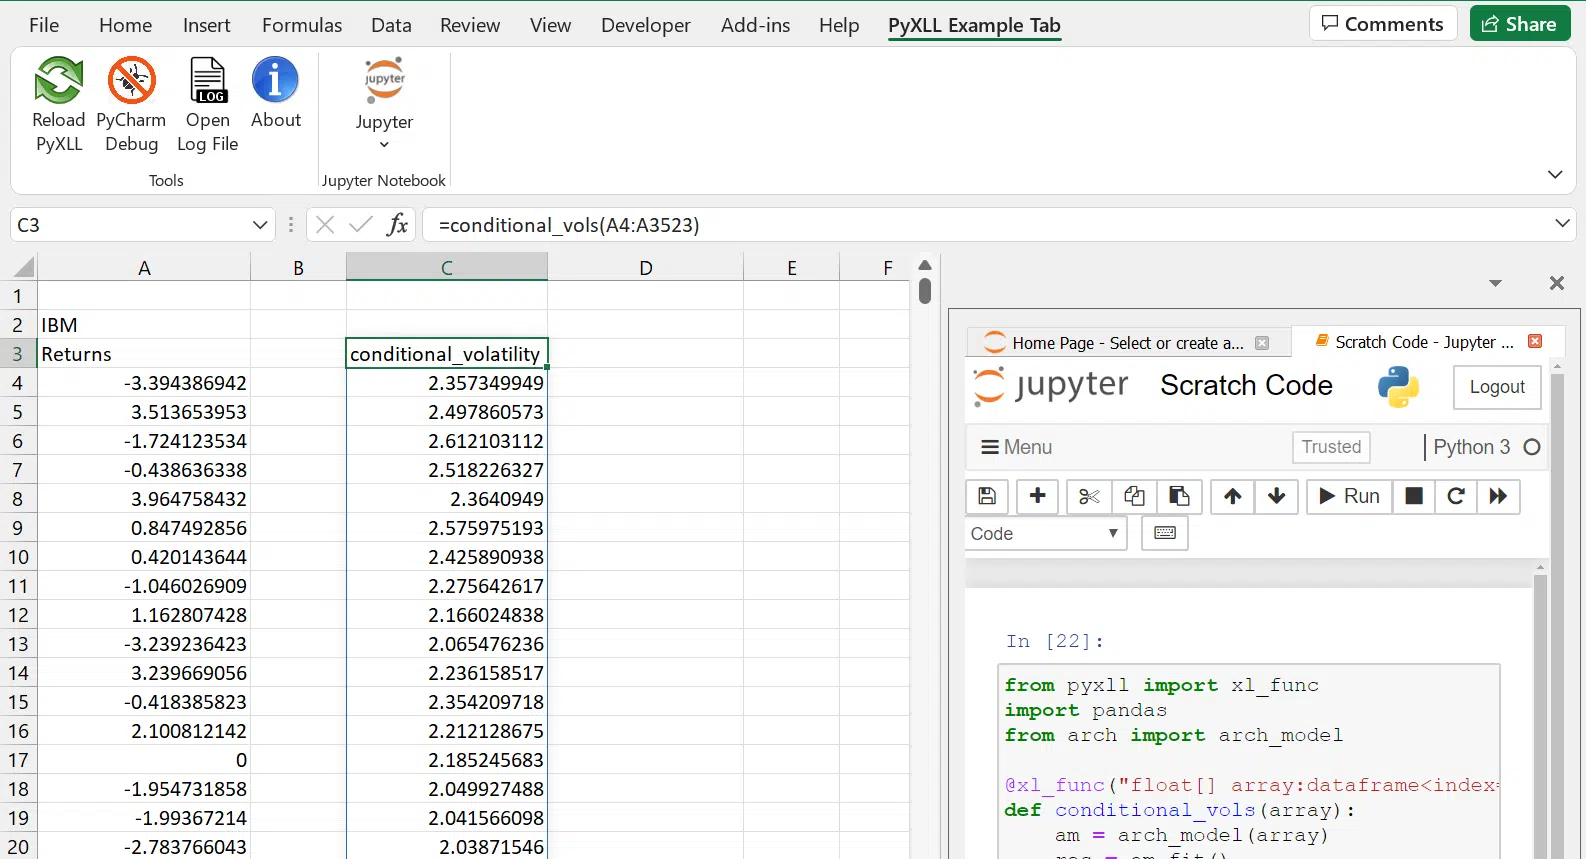
Getting the conditional volatilities from the model
As well as the model parameters, the Garch model can also return us the conditional volatilities. To access those we can write a function similar to our garch_parameters function, but getting the conditional volatilities from the model instead.
from pyxll import xl_func
import pandas
from arch import arch_model

@xl_func("float[] array:dataframe<index=False>")
def conditional_vols(array):
    am = arch_model(array)
    res = am.fit()
    df = pandas.DataFrame(data={
        "conditional_volatility": res.conditional_volatility
    })
    return df
Rather than using “res.params”, here we use “res.conditional_volatility”. This function takes the same array of returns as the garch_parameters function, and we can call it from Excel with our loaded returns data.
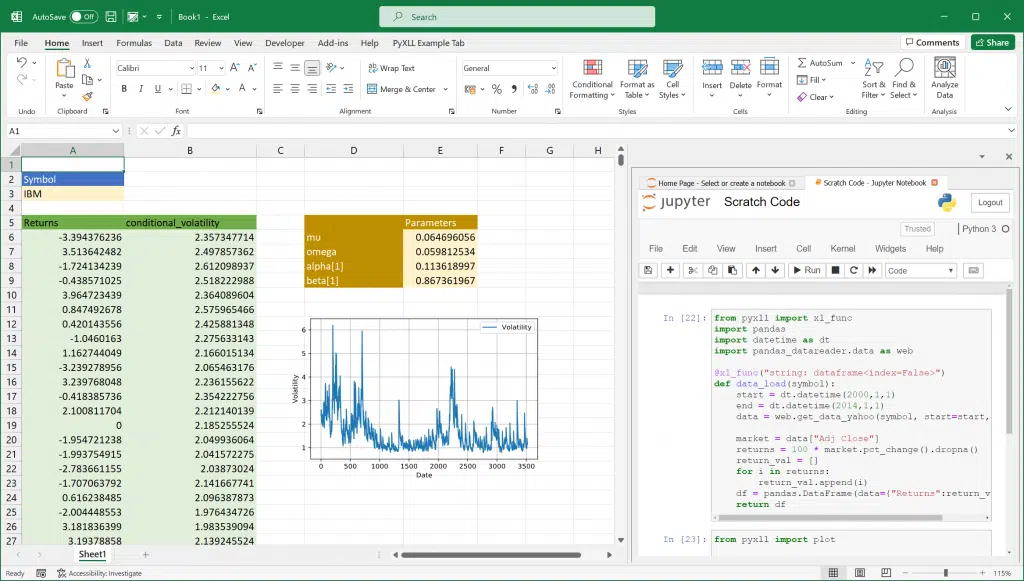
Plotting the results
Pandas has excellent plotting capabilities. Using the pyxll.plot() function we can display plots made with pandas in Excel. The following function takes a list of numbers and uses pandas to do a simple line plot:
from pyxll import plot

@xl_func("float[]")
def plot_a(data):
    df = pandas.DataFrame(data={"Volatility":data})
    df.plot(kind='line',
            xlabel="Date",
            ylabel="Volatility",
            grid="True")
    plot()
The last line, “plot()” (imported from the pyxll package) displays the pandas plot in Excel below where the function is called from.
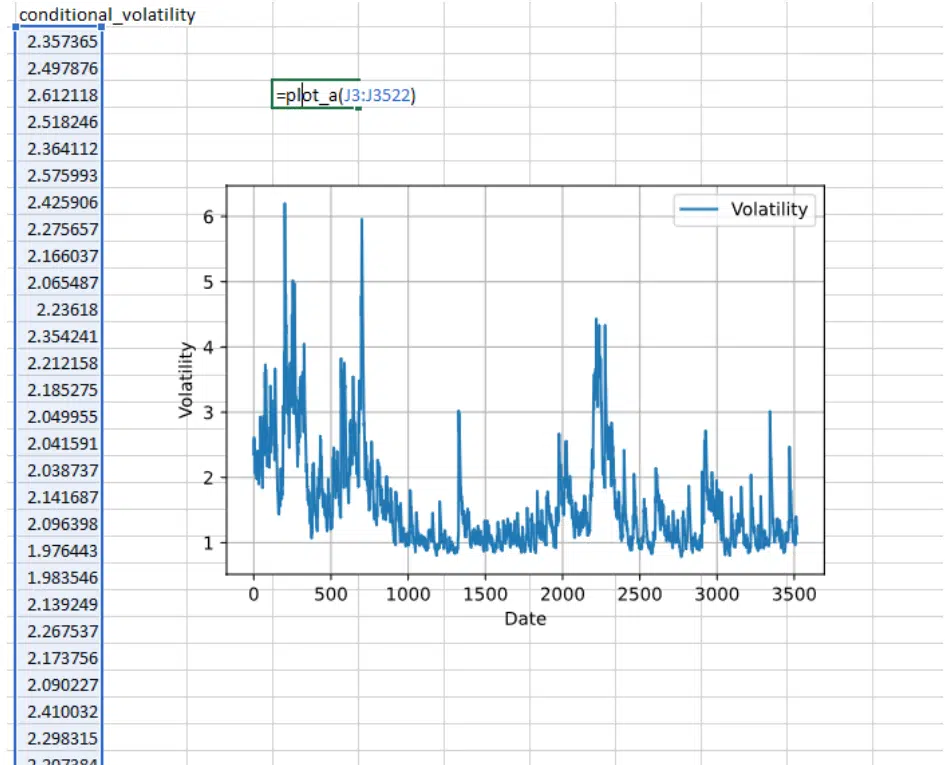
As we change the inputs to the model the output are recalculated automatically, and the plot updates.
Next Steps…
In this article we have seen how to fit a Garch model using the Python package “arch”. We also saw how we can call the Python model from Excel, load data, and extract results from the model.
Garch models are commonly used for forecasting future volatility as part of a trading strategy. The approaches used in this blog can be extended to make predictions based on inputs in Excel. Using Excel as a front-end to a model means that we can interact with it very easily. Any change to an input results in the calculations being recomputed automatically and the results update in real time.
As the code is plain Python code it can be used outside of Excel, for example for unit testing or as part of a batch process. Our Python code takes advantage of sophisticated Python packages, and our Excel spreadsheet simply calls that same Python code.
By adding more Garch functions to our Python module we could build up a complete toolkit of Garch functions in Excel. This could be used to perform analysis directly in Excel, or even build a trading application where all of the inputs and outputs are available to the Excel user. Using the pyxll.plot function allows us to build dashboard like features into our Excel application.
References
- The “arch” Python package: https://arch.readthedocs.io/en/latest/
- PyXLL, the Excel Python Add-In: https://www.pyxll.com
- Writing Worksheet functions in Excel using PyXLL: https://www.pyxll.com/docs/videos/worksheet-functions.html
- Python Juputer notebooks in Excel: https://www.pyxll.com/blog/python-jupyter-notebooks-in-excel/
- Pandas: https://pandas.pydata.org/
- Python Plotting in Excel: https://www.pyxll.com/docs/userguide/plotting/index.html