Table of Contents
Introduction
When faced with errors in your Python code, don’t forget that PyXLL logs all errors to its log file! This can often be a quick and simple way to debug problems when an IDE with debugging capabilities isn’t available (or even when it, looking at the log file is often the quickest way to see what’s gone wrong). You can find the location of the PyXLL log file in your pyxll.cfg file. Set the verbosity to ‘debug’ in the LOG section of that file to get more detailed logging output.
Unit Testing and Running Code Outside of Excel
Build your Python functions that you intend to expose to Excel so that they can be run as separate functions outside of Excel. This way, you can add tests for your code to ensure that it works as intended before trying it in Excel!
If you do this, you can use whatever development tools you are already using without having to worry about connecting to Excel, and you can test changes before rolling them out to users who use your code in Excel.
PyXLL comes with a Python package containing stub functions for all the pyxll functions and function decorators. Install this into your Python environment and you will be able to import and use code that references pyxll functions so that you can run and test them outside of Excel. This package can be installed using pip.
pip install pyxll
# or
pip install .\pyxll-3.x-cpXX-non-winXX.whl
The exact file name will depend on the version of PyXLL you have downloaded.
As well as debugging your code it can also be helpful to use a profiler. See https://www.pyxll.com/blog/how-to-profile-python-code-in-excel/ for details of how you can profile your Python code in Excel.
PyCharm
[UPDATED 2022-08-04]
PyCharm is a commercial IDE by JetBrains that can be used to debug your Python code while running in Excel.
https://www.jetbrains.com/pycharm/
For a more detailed guide to debugging Python functions in Excel with PyCharm please see https://www.pyxll.com/blog/debug-python-code-in-excel-with-pycharm/.
There is a community edition, but at the time of writing only the professional (paid) version supports attaching the debugger to Excel to allow you to debug your Python code running in PyXLL.
PyCharm’s debugger has an “Attach To Process” feature that lets you attach the debugger to a running Python process that wasn’t started by PyCharm. This is perfect for attaching to the Python interpreter running in Excel through PyXLL!
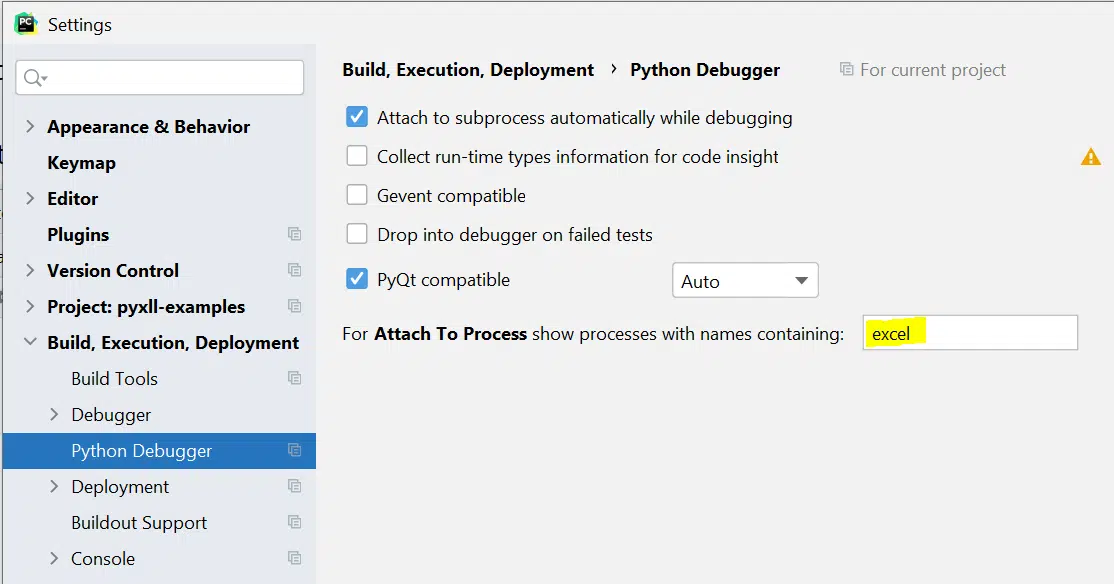
By default, PyCharm will only show you processes to attach to that are called “python”. Before you can attach to Excel to debug your PyXLL functions you need to change this by going to File -> Settings. Under the “Build, Execution, Deployment” section find the “Python Debugger” settings. You will see the setting “For Attach To Process show processes with names containing:”, which will be set to “python”. Change this to “excel” to show only Excel processes, or leave it blank to show all processes.
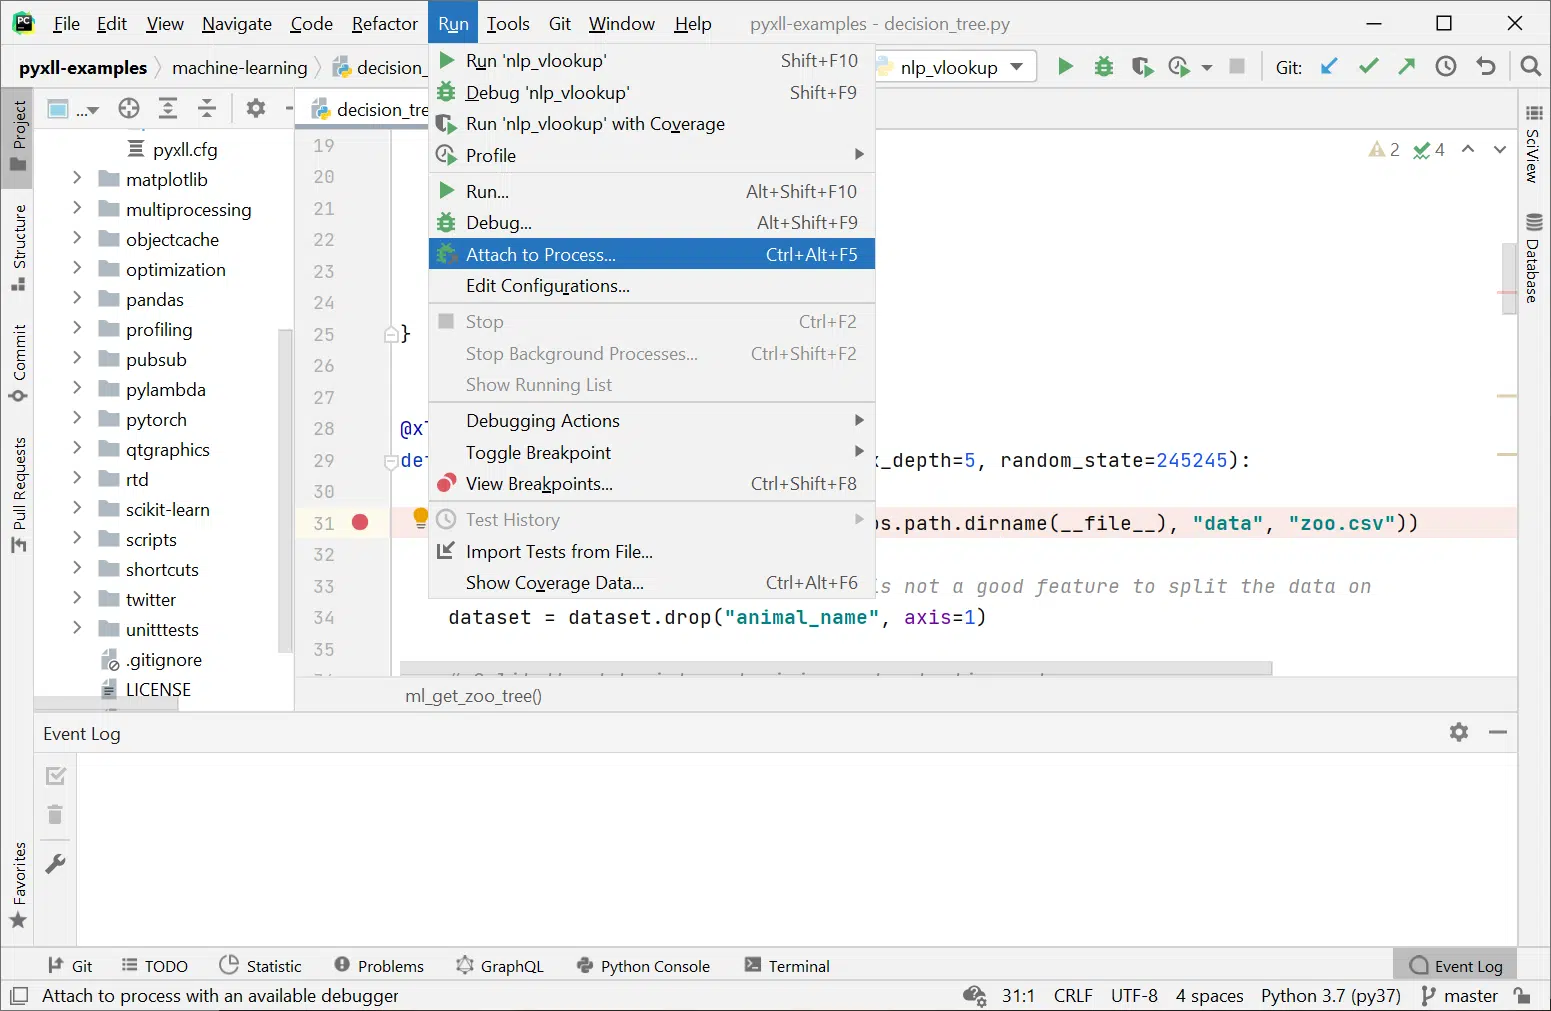
Next, with Excel runinng and the PyXLL add-in loaded, in PyCharm go to “Run -> Attach to Process…”.
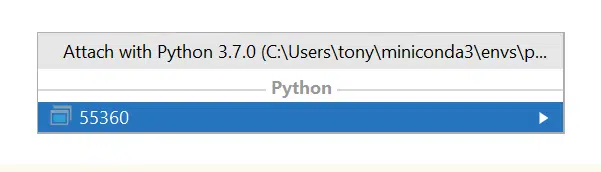
You will then be prompted with a list of processes to choose from. If you followed the steps above to filter the processes containing “excel” you will only see a single process, which is the Excel process you want to debug.
If there are multiple Excel processes running then check which process you want to attach to using the Windows Task Manager. If you are not sure which process is the one you want then you can add a PyXLL function to tell you the process id and call that from Excel. For example:
from pyxll import xl_func
import os

@xl_func
def getpid():
    # This will return the Excel process ID so you know which
    # process to attach the debugger to
    return os.getpid()
Once you’ve selected the Excel process to attach the debugger to you should see the following in the debug console in PyCharm:

With the debugger connected you can now set breakpoints and when you run your functions in Excel it will stop on those breakpoints and allow you to step through your code in the usual way.
If you have any trouble in attaching the debugger, or if PyCharm shows a timeout error when attempting to connect, check the following:
- You do not have any of the packages “pydevd_pycharm”, “pydevd” or “ptvsd” installed. These will interfer with the operation of PyCharm’s Attach To Process feature unless they are exactly the right version; it is better to not have them installed at all and to let PyCharm use it’s own version of pydevd.
To uninstall these packages run:pip uninstall pydevd_pycharm pydevd ptvsd
Check your “site-packages” folder to make sure they have been removed.
- You are using the latest version of PyCharm. This post was written using PyCharm 2022.2 (Professional Edition).
- Check your PyXLL log file for any errors.
Visual Studio Code
For a more detailed guide to debugging Python functions in Excel with VS Code please see Use VS Code to Debug Python Functions in Excel.
Visual Studio Code (or VS Code) is a lightweight programming IDE with extensions for many languages, including Python. The Python extension for VS Code features a debugger than can be used to debug Python code running in Excel.
If you don’t already have VS Code and the Python extension, you can download them from the links below.
https://code.visualstudio.com/download
https://marketplace.visualstudio.com/items?itemName=ms-python.python
If you are new to developing Python code in VS Code, there is a tutorial available here:
https://code.visualstudio.com/docs/python/python-tutorial
See the following link for the VS Code documentation on debugging Python code
https://code.visualstudio.com/docs/python/debugging
Once you have installed and familiarised yourself with VS Code, you are ready to debug your Python code running in Excel.
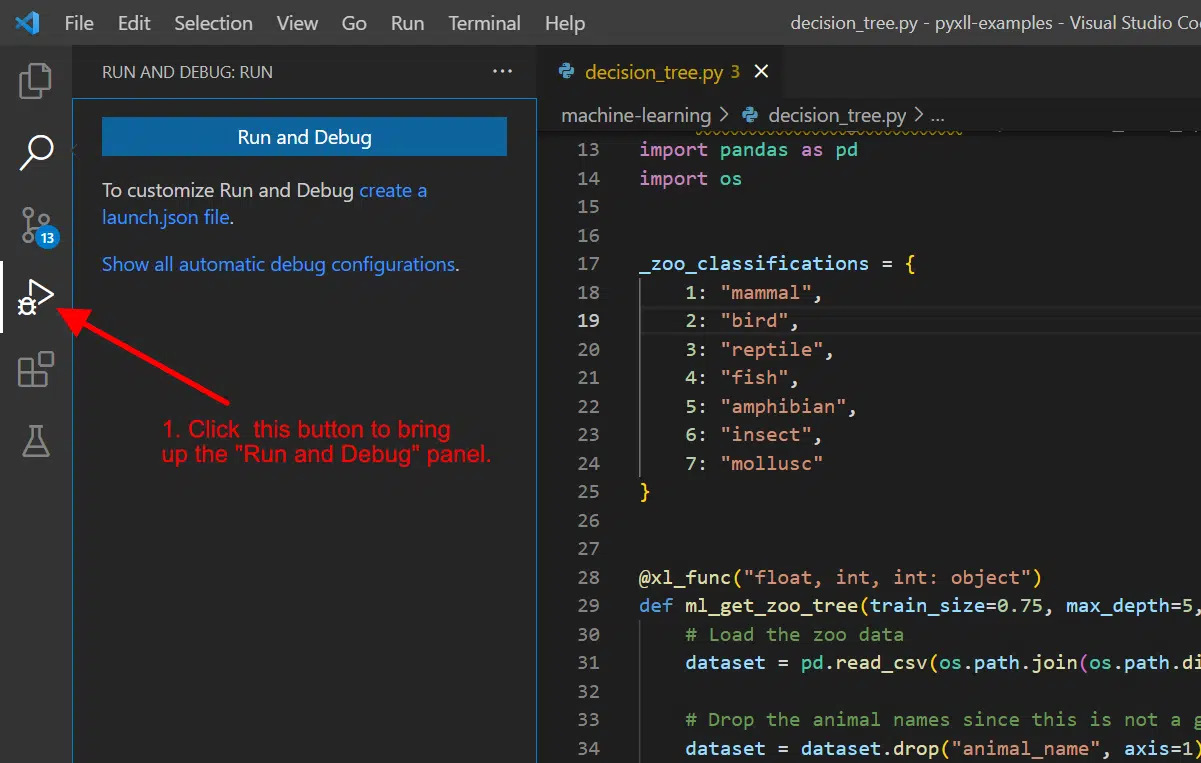
To start debugging click the “Run and Debug” button in VS Code.
If you already have some Run Configurations set up for your project, click the down arrow to the right of the currently selected run configuration and select “Add Configuration…”.
If you do not have any Run Configurations yet you will see a blue button “Run and Debug”. Click that to create your first run configuration.
When prompted to select a debugger select “Python”, and then for the debug configuration select “Attach using Process ID”.

After selecting “Attach using Process ID” you will be shown a list of running processes. Type”EXCEL.EXE” into the drop down and select the Excel process. This will attach the debugger to the Python interpreter running in Excel. You should already have Excel running with the PyXLL add-in loaded at this stage.
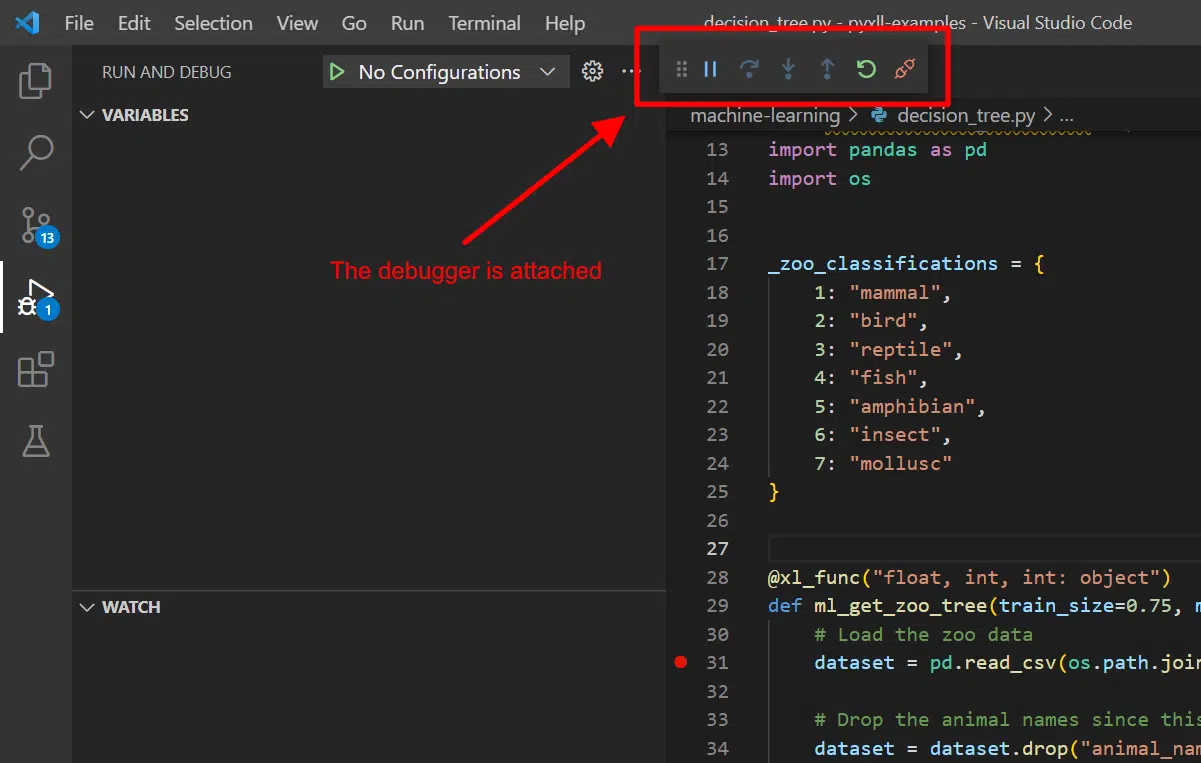
After a short delay the status bar at the bottom of VS Code will change color to indicate that the debugger is attached. You will also see the debug icons at the top of the VS Code window.
If you get an error at this stage, check the PyXLL log file. One common error is that a conflicting version of the Python package “pydevd” has already been imported. If that is the case, remove that package from your Python environment so the VS Code package can be used instead and try again.
Once the debugger is connected you can set break points and debug your code as it runs in Excel. When you have finished debugging use the disconnect button in the VS Code debug toolbar to disconnect from Excel.
Eclipse
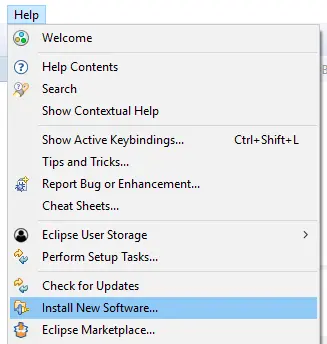
To debug Python code with Eclipse you must first install the “PyDev” plugin. If you don’t have this installed already, go to “Help -> Install new software” in Eclipse.
Add the PyDev repository “http://www.pydev.org/updates” and select the PyDev package.
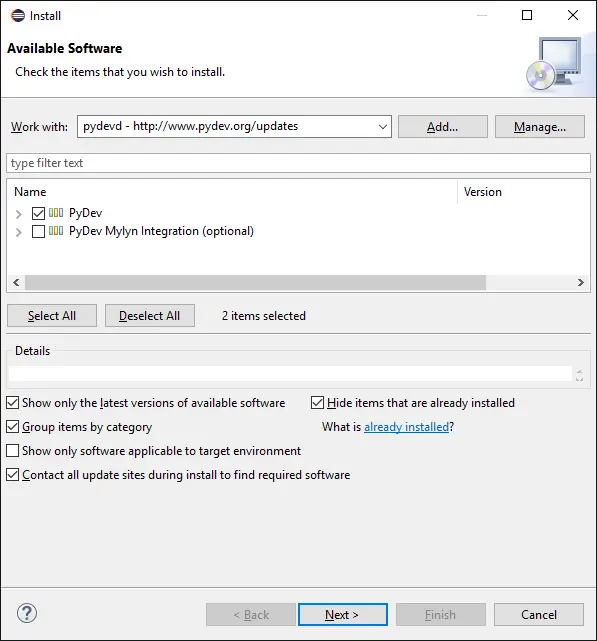
Click “Next” to continue the installation and follow the instructions. Once finished Eclipse will restart.
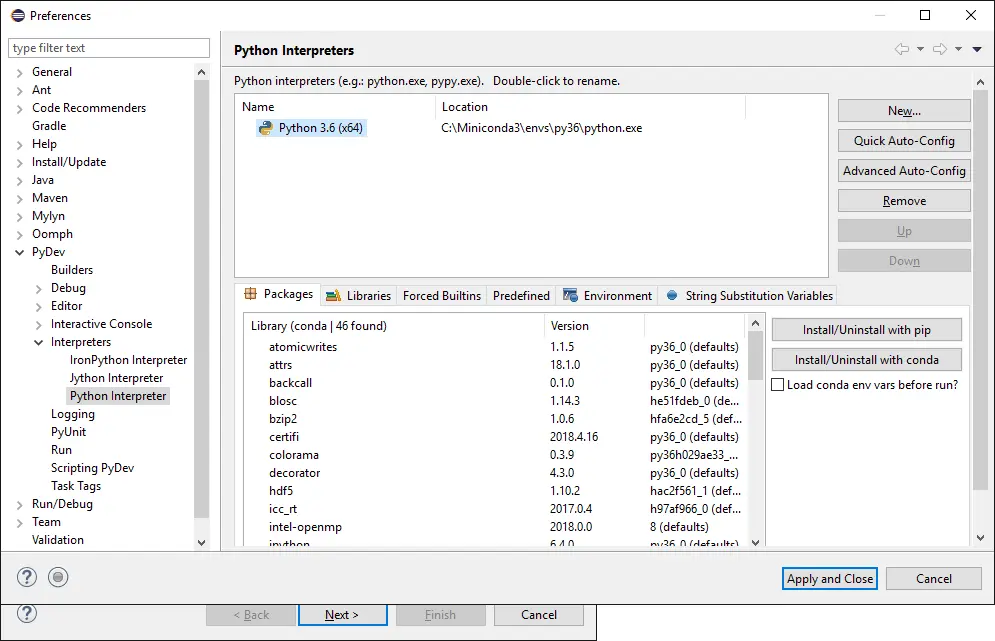
Set up a Python interpreter in Eclipse that matches the one you are using with PyXLL. To do this, go to “Window -> Preferences” and find the “Python Interpreter” settings under “PyDev -> Interpreters”.
Once that’s complete, start Excel as usual and then attach to it by going to “Pydev -> Attach to Process”.
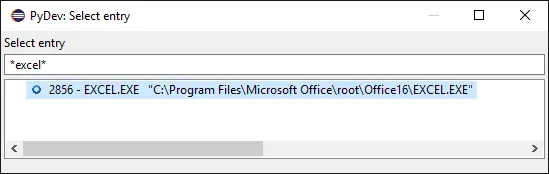
Note that by default, the processes are filtered by “python“. You will have to change this filter to find the Excel process to attach to.
Next, select the Python interpreter set up previously that matches the one used by PyXLL.
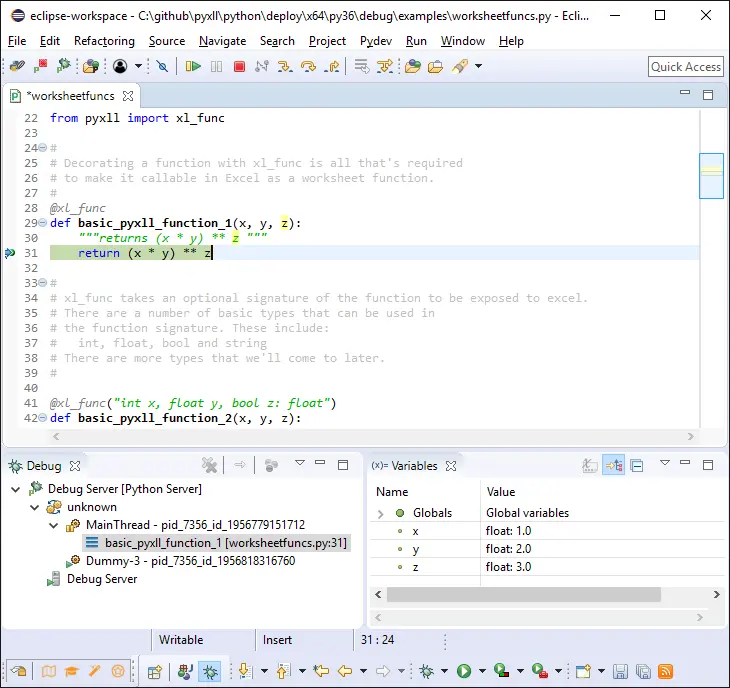
Once attached, you can now set breakpoints and the debugger will stop when they are hit. When a breakpoint is hit, you can then inspect variables and step through your code.
Older versions of the Pydev plugin for Eclipse did not have this “Attach to Process” option. If you are using an older version that does not have this option you should consider updating. Alternatively, you can use the “Start debug server” option and use “pydevd.set_trace” to connect to the debug server. See http://www.pydev.org/manual_adv_remote_debugger.html for more details.
Python Tools for Visual Studio (PTVS)
Python Tools for Visual Studio (PTVS) is a plugin for Visual Studio for the development of Python code. It has an interactive debugger that can be used to debug Python code running in Excel via PyXLL.
https://visualstudio.microsoft.com/vs/features/python/
You’ll need to have Visual Studio installed. For instructions for how to install the PTVS plugin see https://docs.microsoft.com/en-gb/visualstudio/python/installing-python-support-in-visual-studio. You run the Visual Studio installer, select ‘Modify’ and add Python language support to your Visual Studio install.
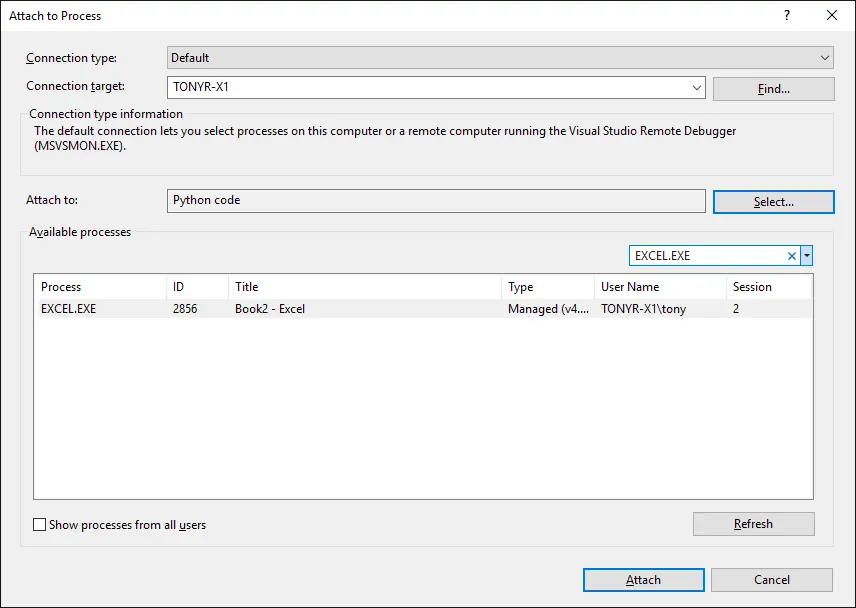
Start Excel as usual, then in Visual Studio, go to “Debug -> Attach to Process…” and find EXCEL.EXE. When you select it, it should show “Python Code” in the “Attach To” box to indicate it has detected the process has Python code it can debug. If it shows more than just “Python code” in the “Attach To” box, click “Select…” next to it, check “Debug these code types” and select “Python”.
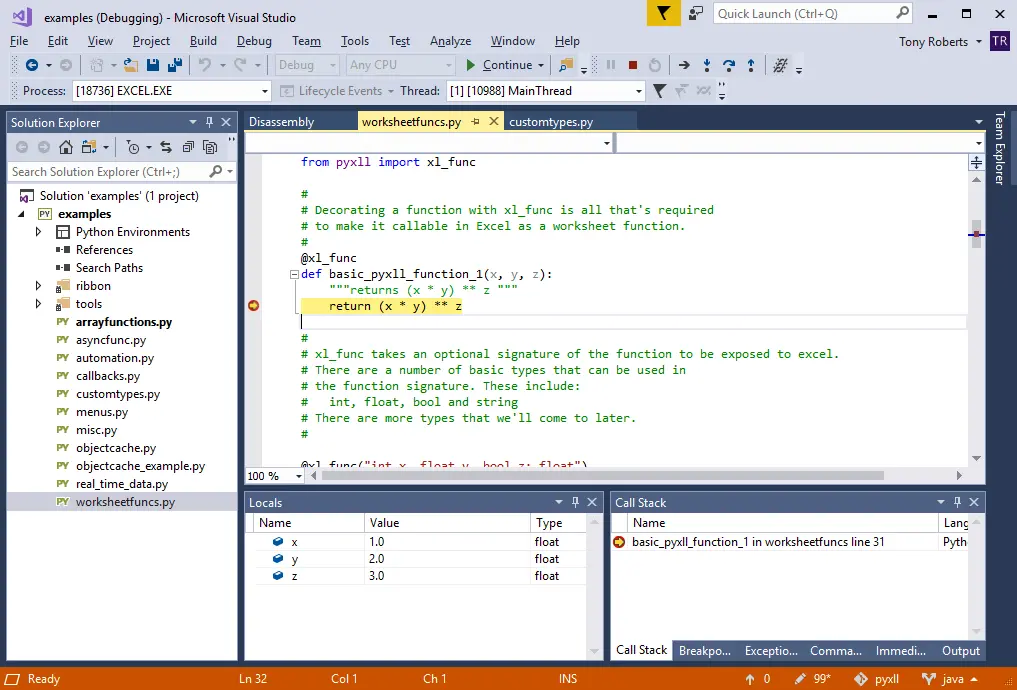
Click “Attach”, and now you can set breakpoints in Visual Studio and it will pause the execution of your code when those breakpoints are hit. You can then step though your code and inspect variables.
Depending on your debugging options, pressing “Stop” in Visual Studio may terminate the Excel process. There’s no need to stop the debugger, but if you want to you can select “Detach All” from the Debug menu to detach without terminating Excel.
Wing IDE
Wing IDE is a dedicated Python development environment with an integrated visual debugger. The Wing debugger can be used to step through and debug Python code running in Excel.
Either “Wing Pro” and “Wing Personal” can be used and the instructions are the same for each.
Start by finding the folder where Wing IDE is installed. If you are not sure or can’t find it go to Help -> About... in Wing and you will find the folder where it says “Install Directory”. Go to that folder on your computer and copy the file wingdbstub.py to the folder containing your Python code that you want to debug.
Open the wingdbstub.py file that you have just copied and make the following changes:
- Check
WINGHOMEis set to the folder where Wing IDE is installed to - Set
kEmbedded = 1
For the debugger to work, the wingdbstub module must be imported. This can either be done by adding “import wingdbstub” to one of the Python modules are you using, or you can add wingdbstub to the modules list in your pyxll.cfg file.
import wingdbstub
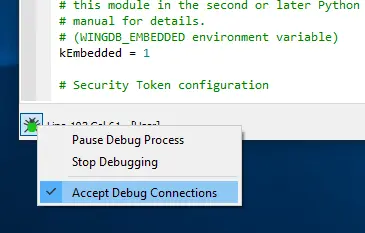
In Wing IDE click the Debug icon at the bottom left of the application window and select “Accept Debug Connections”.
Now restart Excel or reload the PyXLL add-in so that the wingdbstub module is imported and it will connect to the Wing IDE debugger. Set some breakpoints in your code and when the Python code running in Excel hits a breakpoint it will pause in the Wing IDE debugger, allowing you to inspect variables and step through the code.
If this doesn’t work at first try using wingdbstub.Ensure() to force wingdbstub to make the connection to the debugger. If it can’t connect then check that the Wing IDE application is allowed to make network connections in your Windows Firewall settings.
from pyxll import xl_func
import wingdbstub

@xl_func
def debug_test():
    wingdbstub.Ensure()
    return "Connected Ok!"
To allow the Wing IDE app through the Windows firewall, go to the Start menu on your PC and type “Allow an app through Windows firewall”, select “Change Settings” and then “Allow another app…”. Navigate to the Wing IDE folder and select the Wing IDE executable from the bin folder. Restart Wing IDE and Excel and now the two should be able to connect.
TIP: Why not add this as a ribbon function so it’s easier to find? See https://www.pyxll.com/docs/userguide/ribbon.html for details of how to do that.
See https://wingware.com/doc/debug/debugging-embedded-code for more information about how to debug your Python code in Excel with Wing IDE.
Other
If you are using another IDE it may also have remote debugging capabilities. Search online for help connecting your IDE’s debugger to an external process (this is commonly referred to as “remote debugging”).
If your IDE cannot attach to remote Python processes and you don’t want to use any of the suggestions above for debugging your code, another alternative is Winpdb. This is a visual debugger, not an IDE, and so you can use it only for debugging and continue to use your chosen IDE for development.
Using a Jupyter Notebook is perect for trying out snippets of code interactively. Read about how you can use Jupyter Notebooks in Excel here https://www.pyxll.com/blog/python-jupyter-notebooks-in-excel/.
Update: WinPdb is no longer being maintained and the website is now down. There is however a new fork that is being actively developed – see https://pypi.org/project/winpdb-reborn/1.5.0/. The documentation page no longer exists, but you can find the last version of it here https://web.archive.org/web/20180117043207/http://winpdb.org/docs/embedded-debugging/ until the documentation for the new fork is available. The call to “rpdb2.start_embedded_debugger” can be wrapped in an Excel menu using @xl_menu to start the debugger when needed.