Pandas DataFrames are Excel are a great match as both deal with 2d tables of data. With PyXLL, you can pass data as pandas DataFrames between Python and Excel easily.
You can also use polars DataFrames as well as pandas.
To distinguish between polars and pandas, use the polars.dataframe and
pandas.dataframe types instead of just dataframe in your function
signatures.
If you use just dataframe PyXLL will default to using pandas.
See Polars DataFrames for more information about polars types in PyXLL.
By far one of the most common ways to work with pandas data in Excel is with a worksheet function that returns a DataFrame.
If you are not already familiar with writing Excel worksheet functions in Python using PyXLL, please see Worksheet Functions first.
This video demonstrates how to write worksheet functions in Python, using PyXLL. It also covers returning pandas DataFrames from functions towards the end of the video.
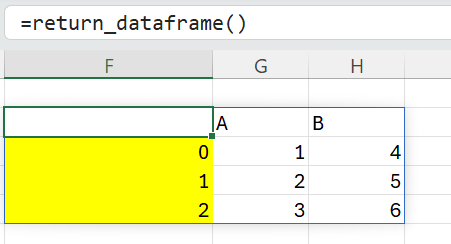
Consider the following function that returns a panda DataFrame:
import pandas as pd
from pyxll import xl_func

@xl_func
def return_dataframe():
     """A function that returns a DataFrame."""
    df = pd.DataFrame({
       "A": [1, 2, 3],
       "B": [4, 5, 6]
    })

    return df
The @xl_func decorator exposes the return_dataframe function to Excel as a worksheet function,
but when we call this function from Excel the result might not be exactly what you expected:
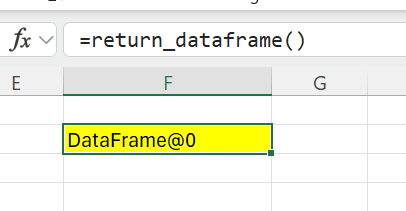
The DataFrame object here is being returned as an object handle. This object handle can be passed to other PyXLL functions and the Python function will be called with the actual pandas DataFrame object. This is really useful (and very fast) as it allows us to pass large, complex objects between Python functions easily.
However, it is not what we want in this case!
We need to tell the PyXLL add-in to convert the returned DataFrame object into a range of values so that all of the DataFrames values get returned to the Excel grid.
To do that, we need to specify the return type when declaring the function. That is done either by adding
a function signature to the @xl_func decorator; using the @xl_return decorator; or
by using a Python type annotation.
The simplest method is to add a function signature to our function as follows:
import pandas as pd
from pyxll import xl_func

@xl_func(": dataframe")
def return_dataframe():
     """A function that returns a DataFrame."""
    df = pd.DataFrame({
       "A": [1, 2, 3],
       "B": [4, 5, 6]
    })

    return df
Note that we don’t have any arguments. The function signature is of the form argument types: return type and so
in our signature above we don’t have anything before the : as there are no arguments to the function.
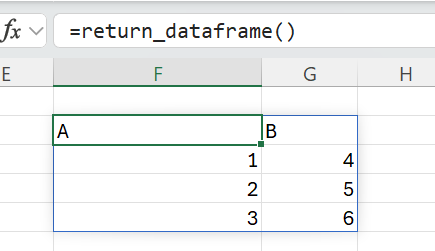
With the return type now specified, when we call the function in Excel the PyXLL add-in will convert the pandas DataFrame object to an array of values:
The dataframe return type can be parameterized using various options. These options control how the pandas DataFrame object is converted to the array that you see in Excel.
For example, if you want the index to be included in the array shown in Excel, you can set the index option
to True (by default, the index is only included if it is a named index):
import pandas as pd
from pyxll import xl_func

@xl_func(": dataframe<index=True>")
def return_dataframe():
     """A function that returns a DataFrame."""
    df = pd.DataFrame({
       "A": [1, 2, 3],
       "B": [4, 5, 6]
    })

    return df
For more details of how to specify return types and their type parameters, please see Argument and Return Types.
You can find the documentation for all of the available parameters for the dataframe return type
on the Pandas Types page.
In the above section we saw how by specifying the function return type, PyXLL can convert the returned pandas DataFrame to an array of values on the Excel grid.
Similarly, PyXLL can also convert a range of values from the Excel grid passed to a function into a pandas DataFrame.
Let’s look at an example function that takes a DataFrame argument, as well as a string and returns a number:
import pandas as pd
from pyxll import xl_func

@xl_func("dataframe df, str col: float")
def sum_column(df, col):
    """Sum the values in a column."""
    column_sum = df[col].sum()
    return column_sum
The function signature passed to @xl_func specifies that the argument df should be converted
from a range of Excel values to a pandas DataFrame.
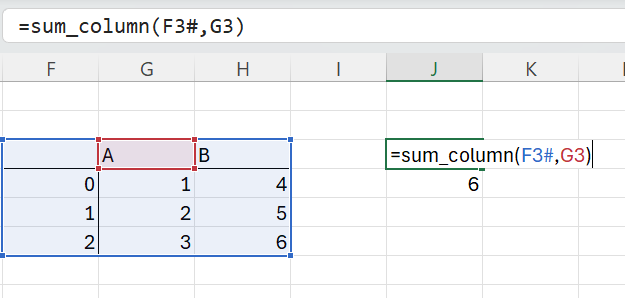
To call this from Excel we enter it as a formula, passing in our data range including the column headers, and the column we want to sum.

PyXLL converts the input range argument to a pandas DataFrame for us and calls our sum_column function with that converted DataFrame.
We can also specify various type parameters to the dataframe argument type, as with the return type. For
example, the index option can be used to specify the number of columns to use as the index for the
DataFrame (if supplying an index).
Instead of using the function signature as shown above, another option is to use the @xl_arg
decorator. This works in the same way, but lets us specify the argument type parameters as keyword
arguments to the @xl_arg decorator.
For example, the function above could be re-written as follows:
import pandas as pd
from pyxll import xl_func, xl_arg, xl_return

@xl_func
@xl_arg("df", "dataframe")
@xl_arg("col", "str")
@xl_return("float")
def sum_column(df, col):
    """Sum the values in a column."""
    column_sum = df[col].sum()
    return column_sum
And to specify that the first column is to be used as the DataFrame index, we would set the index type
parameter like so:
import pandas as pd
from pyxll import xl_func, xl_arg, xl_return

@xl_func
@xl_arg("df", "dataframe", index=1)  # equivalent to "dataframe<index=1>"
@xl_arg("col", "str")
@xl_return("float")
def sum_column(df, col):
    """Sum the values in a column."""
    column_sum = df[col].sum()
    return column_sum
This time, the DataFrame passed to our sum_column function has its index constructed from the first
column in the Excel range. Setting index to greater than one results in a DataFrame with a MultiIndex.
For more details of how to specify arguments types and their type parameters, please see Argument and Return Types.
You can find the documentation for all of the available parameters for the dataframe argument type
on the Pandas Types page.
New in PyXLL 5.11
When passing a DataFrame as an argument to an Excel function sometimes you might want to pass a larger range than the actual data.
For example, when creating a sheet you might allow some extra rows in case the data grows, or to allow space for the user of the sheet to add more rows. You might even select a range of entire columns.
Converting a larger range than necessary takes additional time when constructing the DataFrame. Instead of constructing the entire DataFrame and then removing empty rows in your Python code, it is much more efficient (and easier!) for PyXLL to trim any trailing empty rows or columns from the Excel data before constructing the DataFrame.
To tell PyXLL to trim empty space use the trim type parameter to the dataframe type.
For example:
import pandas as pd
from pyxll import xl_func

@xl_func("dataframe<trim=True> df, str col: float")
def sum_column(df, col):
    """Sum the values in a column."""
    column_sum = df[col].sum()
    return column_sum
The function above can now accept a large range including empty rows and columns around the actual data. Before the DataFrame is constructed the data is trimmed to remove empty rows and columns from the top, bottom, left and right of the data.
When specifying trim=True any empty rows from the top or bottom of the range, or empty columns from the left
or right of the range, will be removed.
If you only want to trim rows or columns from certain directions instead of using trim=True you can use
a string to specify top, left, bottom and/or right by using the characters t, l, b, r, respectively.
For example, to only trim rows from the bottom and columns from the right you would use trim='br'.
Sometimes you might have a function that returns more than one DataFrames.
When returning values to Excel, the result has to fit into a grid and so returning multiple DataFrames doesn’t fit as well as a single DataFrame.
If it makes sense to break your function into multiple functions, with each one returning a different DataFrame, that is a good solution. But, if that’s not feasible or results in unwanted recomputation and you need to keep it all in one function, you can return multiple DataFrames from a single function.
Rather than returning multiple DataFrames as multiple grids of data from a single function, instead we have to return them as a list of objects. By returning them as a list of objects this then fits into Excel’s grid.
import pandas as pd
from pyxll import xl_func

@xl_func(": object[]")
def multiple_dataframes():
    """A function that returns multiple DataFrames."""
    df1 = pd.DataFrame({
       "A": [1, 2, 3],
       "B": [4, 5, 6]
    })

    df2 = pd.DataFrame({
       "X": [-1, -2, -3],
       "Y": [-4, -5, -6]
    })

    return [
        df1,
        df2
    ]
Above we’re using the object[] return type. The list of DataFrames returned by the function
are returned to Excel as an array of object handles:
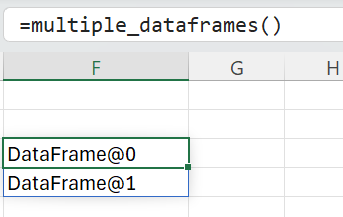
Our function returns multiple DataFrames, but as an array of object handles.
Next we need to convert those object handles into Excel arrays, which we can do with another
function. This next function doesn’t do anything, but by specifying dataframe as the
return type PyXLL will do the conversion for us:
import pandas as pd
from pyxll import xl_func

@xl_func("object df: dataframe")
def expand_df(df):
    if not isinstance(df, pd.DataFrame):
        raise TypeError("Expected a DataFrame object")

    # Will be converted to an Excel array because of the return type
    return df
We can now call this new function on the objects returned previously to get the contents of the DataFrames:

PyXLL has a feature for applying cell formatting to the results of a worksheet function. This can be very useful for giving your spreadsheets a consistent look and feel, as well as saving time applying formatting manually.
For complete details about cell formatting, please see the Cell Formatting and Pandas DataFrame Formatting sections of the user guide.
The following video also explains how the cell formatting functionality can be used:
Pandas DataFrames can be plotted using the DataFrame.plot method. This is a convenient way to quickly produce plots from DataFrames.
The DataFrame.plot method uses the plotting package matplotlib. The PyXLL add-in can display matplotlib figures directly in
Excel, and so it is also possible to display plots of pandas DataFrames in Excel.
The function plot takes a matplotlib figure and displays it in Excel. To display a pandas plot we first create a matplotlib
Figure and Axes. Then we call DataFrame.plot, passing in the Axex object as we want it to plot to the matplotlib figure
we created. Finally, we call plot to display the figure in Excel.
from pyxll import xl_func, plot
import matplotlib.pyplot as plt
import pandas as pd

    @xl_func
    def pandas_plot():
        # Create a DataFrame to plot
        df = pd.DataFrame({
            'name':['john','mary','peter','jeff','bill','lisa','jose'],
            'age':[23,78,22,19,45,33,20],
            'gender':['M','F','M','M','M','F','M'],
            'state':['california','dc','california','dc','california','texas','texas'],
            'num_children':[2,0,0,3,2,1,4],
            'num_pets':[5,1,0,5,2,2,3]
        })

        # Create the matplotlib Figure and Axes objects
        fig, ax = plt.subplots()

        # Plot a bar chart to the Axes we just created
        df.plot(kind='bar',x='name',y='age', ax=ax)

        # Show the matplotlib Figure created above
        plot(fig)

        return "OK!"
The above code creates a DataFrame. It then creates a matplotlib figure and plots the DataFrame onto that figure. Finally
it displays the plot in Excel using the plot function.

For more details on plotting with PyXLL, and plotting pandas DataFrames in Excel, please see Plotting with Pandas.
Macro functions can be called from Excel buttons and other controls, as well as from VBA.
Excel macros can automate Excel in the same way as VBA. They can also read and write values in the Excel workbooks.
If you’re not already familiar with writing macro functions using PyXLL, please see Introduction.
With PyXLL, the entire Excel object model is exposed (see Python as a VBA Replacement), but for dealing with pandas DataFrames (and other types) the Python values need to converted to something that Excel understands.
This can be done using PyXLL’s XLCell class.
In a macro function we can get the Excel Application object using xl_app. This is the
same as the VBA Application object. From that, we can get the Range object for which we want to either
read or write the DataFrame.
Once we have the Range object, we use XLCell.from_range to get a PyXLL XLCell
object. The XLCell object is similar to the Range object. It’s simpler in most ways, and can only be used
for a contigous range, but it allows us to use PyXLL’s type conversion when getting or setting its value
property.
To read or write the cells’ value as a DataFrame we pass type="dataframe" to the XLCell.options
method before accessing the value property.
from pyxll import xl_macro, xl_app, XLCell

@xl_macro
def read_value_from_excel():
    # Get the Excel.Application COM object
    xl = xl_app()

    # Get a Range in the current active sheet
    xl_range = xl.ActiveSheet.Range("A1:D10")

    # Get an XLCell object from the Range object
    cell = XLCell.from_range(xl_range)

    # Get the value as a DataFrame
    df = cell.options(type="dataframe").value
The above macro reads cells A1:D10 of the currently active sheet as a pandas DataFrame.
The type argument to XLCell.options is the same as the type used in the function signature
in the previous sections. It can be parameterized in the same way to control exactly how the conversion
is done between the Excel values and the pandas DataFrame.
You can pass auto_resize=True to XLCell.options when reading and writing DataFrames
and the cell with automatically resize to fit the data, so you don’t need to specify the full range.
When passing large DataFrames between Python functions, it is not always necessary to return the full DataFrame
to Excel and it can be expensive reconstructing the DataFrame from the Excel range each time. In those cases you
can use the object return type to return a handle to the Python object. Functions taking the dataframe
and series types can accept object handles.
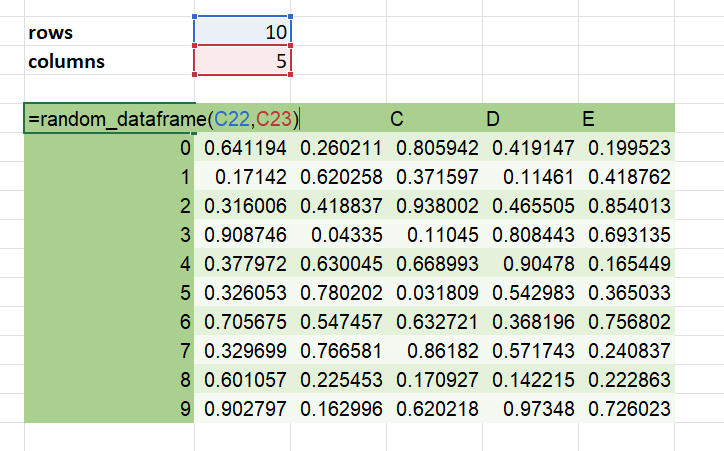
The following returns a random DataFrame as a Python object, so will appear in Excel as a single cell with a handle to that object:
from pyxll import xl_func
import pandas as pd
import numpy as np

@xl_func("int rows, int columns: object")
def random_dataframe(rows, columns):
    data = np.random.rand(rows, columns)
    column_names = [chr(ord('A') + x) for x in range(columns)]
    return pd.DataFrame(data, columns=column_names)
The result of a function like this can be passed to another function that expects a DataFrame:
@xl_func("dataframe, int: dataframe<index=True>", auto_resize=True)
def dataframe_head(df, num_rows):
    return df.head(num_rows)
This allows for large datasets to be used in Excel efficiently, especially where the data set would be cumbersome to deal with in Excel when unpacked.
DataFrames returned from Excel to Python as cached objects are not copied. When the object handle is passed to another function, the object retrieved from the cache is the same object that was previously returned.
You should be careful not to modify DataFrames passed this way (i.e. don’t make changes inplace). Instead create a copy first and modify the copy, or use inplace=False if the pandas method you’re using supports that.
pandas Series objects can be used in a similar way to DataFrames.
Instead of using the dataframe type as described in the sections below, the series type is also available.
Please see Pandas Types for details of all of the pandas types available, including the series type.
Sometimes it’s useful to be able to convert a range of data into a DataFrame, or a DataFrame
into a range of data for Excel, in a context other than function decorated with @xl_func.
You might have a function that takes the var type, which could be a DataFrame depending
on other arguments.
Or, you might want to return a DataFrame but want to decide in your function what type parameters to use to control the conversion. For example, you might want to leave it to use the user to decide whether to include the index or not and give that as an argument to your function.
In these cases the function get_type_converter can be used. For example:
from pyxll import get_type_converter

to_dataframe = get_type_converter("var", "dataframe<index=True>")
df = to_dataframe(data)
Or the other way:
to_array = get_type_converter("dataframe", "var")
data = to_array(df)
Combined with PyXLL’s var type you can pass in values from Excel as a plain array and perform
the conversion in your function. Or, you can specify the return type of your function as var
and convert from the DataFrame before returning the final converted value.
For example:
import pandas as pd
from pyxll import xl_func, get_type_converter
import pandas as pd
from pyxll import xl_func

@xl_func("bool include_index: var")
def return_dataframe(include_index=False):
    """A function that returns a DataFrame."""
    # Create the dataframe
    df = pd.DataFrame({
       "A": [1, 2, 3],
       "B": [4, 5, 6]
    })

    # Get the function to convert from a DataFrame to the PyXLL 'var'
    # return type, specifying the 'index' type parameter.
    to_var = get_type_converter("dataframe", "var", src_kwargs={
        "index": include_index
    })

    # Convert the DataFrame and return the result
    converted_df = to_var(df)
    return converted_df
The above function returns a DataFrame. But, rather than using the dataframe return type to do the
conversion implicitly, it uses the var return type and performs the conversion inside the function.